FOCUS ON: All Eyes on US Interest Rate Decision
- Markets brace for interest rate announcement from US Federal Reserve
- Jerome Powell’s decision on US rates follows a turbulent week in the markets
- Analyst forecasts vary widely as hawkish policy exposes cracks in the underlying economy
Trading Ideas
We created this Weekly Tips section to share possible trade entry and exit points based on our technical analysis. We also have other methods to validate our trades which we can’t publicly share that help to increase their success. All our trades include entry and at least one target price. Stop losses are applied at the reader’s discretion. Our strategies typically trade with a wide stop loss, and risk is further mitigated by trading in small sizes.
Instrument | Price | Hourly | Daily |
GBP/USD | 1.2199 | Strong Buy | Strong Buy |
EUR/USD | 1.0652 | Strong Sell | Buy |
USD/JPY | 130.93 | Strong Sell | Strong Sell |
S&P 500 | 3,892 | Sell | Strong Sell |
NASDAQ 100 | 12,472 | Buy | Strong Buy |
FTSE100 | 7,257 | Strong Sell | Strong Sell |
Gold | 1,998 | Strong Buy | Strong Buy |
Crude Oil WTI | 65.22 | Strong Sell | Strong Sell |
Bitcoin | 28,295 | Strong Buy | Strong Buy |
Ethereum | 1,787 | Strong Buy | Strong Buy |
UTC: 09:52
US Dollar Basket Index (DXY)
From the trading session open on Monday 13th to the close on Friday 17th March the US Dollar Basket index moved only 0.01%, but that statistic hides the amount of price volatility seen in the intervening days. The index touched 103.04 and 104.72 during the week as concerns about banks, such as SVB and Credit Suisse, triggered fears that the financial ecosystem might be about to implode.
Concerns about the health of major banks are the first indications of how the hawkish policy of the US Federal Reserve is impacting the ‘real’ economy. While controlling inflation remains the priority of Jerome Powell and his team, some analysts are forecasting interest rate policy might be adjusted to relieve the stress repeated rate hikes are causing. No one can be certain what Wednesday’s rate decision will be, but few would bet against volatility levels in forex markets picking up during the coming week.
US Dollar Basket Chart – Daily Price Chart – SMA Support
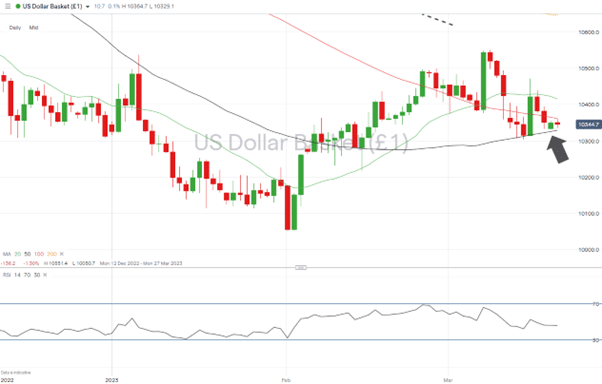
Source: IG
US Dollar Basket Chart – Hourly Price Chart
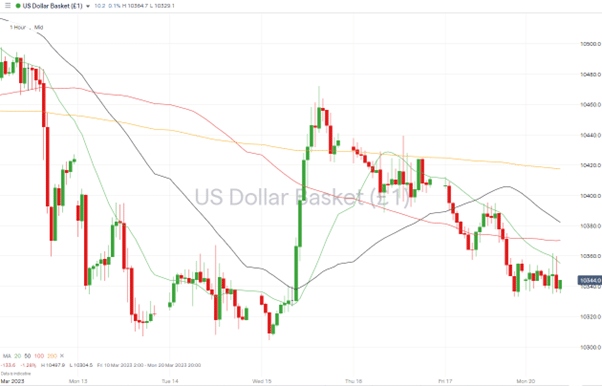
Source: IG
Short positions
- Entry Level 1: 103.29 – Those looking to short the dollar will be looking for a break of the 50 SMA on the Daily Price Chart. That metric having provided support to price levels over the previous week, applying a momentum-based strategy to capture further downward price movement.
- Price Target 1: 102.17 – Intraday low price printed on 14th February. Part of a bullish ‘swing-low’ price pattern.
- Price Target 2: 100.51 – In extension, region of 50 SMA on Daily Price Chart and 1.30 ‘round number’ price level, which can be expected to offer support.
- Stop Loss: > 103.61 – Region of the 100 SMA on the Daily Price Chart.
Long positions
- Entry Level 1: 103.29 – Region of 50 SMA on the Daily Price Chart
- Price Target 1: 103.61 – Region of the 100 SMA on the Daily Price Chart.
- Price Target 2: 104.00 – Round number price resistance level sitting just below the 20 SMA on the Daily Price Chart.
- Stop Loss: < 103.00 – Psychologically important price level.
GBPUSD
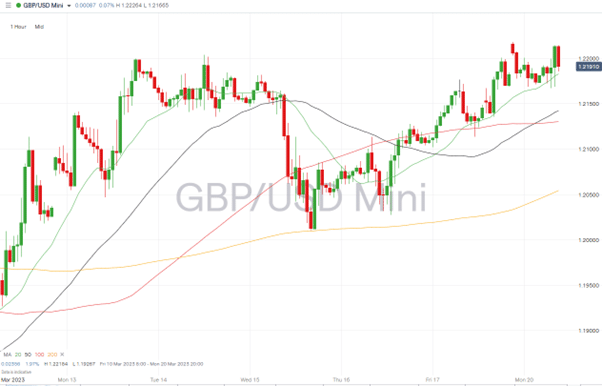
Traders of sterling-based currency pairs can expect volatility levels to be even higher thanks to the Bank of England making its own call on interest rate policy on Thursday 23rd March. With the RSI on the GBPUSD Daily Price Chart at 57, the market is neither ‘overbought’ nor ‘oversold’, which leaves room for the price to move in either direction before meeting significant resistance.
Daily Price Chart – GBPUSD Chart – Daily Price Chart
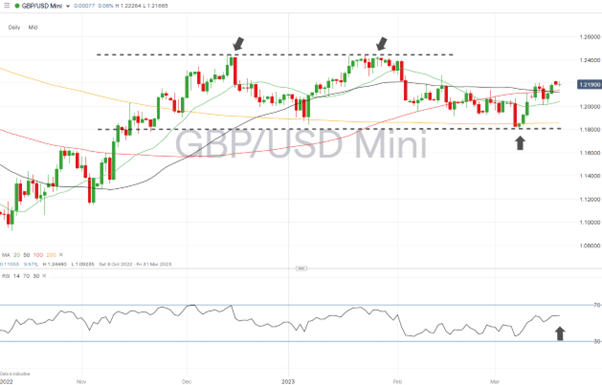
Source: IG
GBPUSD Chart – Hourly Price Chart
Source: IG
Short positions
- Entry Level 1: 1.21380 – Region of the 100 SMA on the Daily Price Chart.
- Price Target 1: 1.20443 – Just above the psychologically important 1.20 price level and region of 20 SMA on the Daily Price Chart.
- Price Target 2: 1.180306 – Year-to-date price low recorded on 8th March.
- Stop Loss: > 1.22184 – Multi-week price high printed on 19th March.
Long positions
- Entry Level 1: 1.21380 – Region of the 100 SMA on the Daily Price Chart.
- Price Target 1: 1.22156 – The 61.8% Fibonacci retracement price level of the price fall between 14th December 2022 and 6th January 2023.
- Price Target 2: 1.224480 – In extension, price high of 23rd January 2023. Year-to-date price high.
- Stop Loss: < 1.20443 – Region of 20 SMA on the Daily Price Chart, just above the psychologically important 1.20 price level.
EURUSD
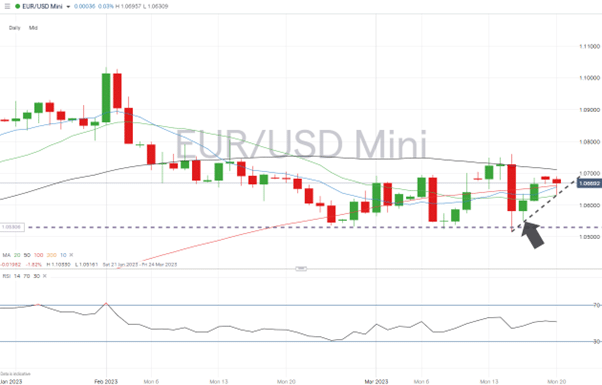
The ECB’s decision on Thursday 16th March caught out some traders. In the run-up to the announcement, market opinion had shifted to the rate hike being only 25 basis points. As a result, the price of the euro rallied into the end of the week. All eyes now turn to the dollar element of the EURUSD pair and the announcement by the Fed on Wednesday on US interest rate levels.
EURUSD Chart – Daily Price Chart
Source: IG
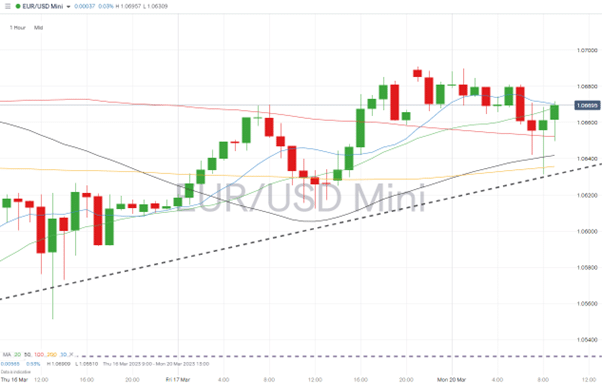
EURUSD Chart – Hourly Price Chart
Source: IG
Short positions
- Entry Level 1: 1.0630 – Selling into downward momentum which triggers a break of the trendline formed on Wednesday 15th March. Also, the region of 20 SMA on the Daily Price Chart.
- Price Target 1: 1.06114 – Level of 38.2% Fib retracement of the EURUSD price fall between January 2021 and September 2022.
- Price Target 2: 1.05161 – Price low of 15th March.
- Stop Loss: > 1.07113 – Region of 50 SMA on Daily Price Chart.
Long positions
- Entry Level 1: 1.06617 – 1.06580 – Region of 100 and 10 SMAs on Daily Price Chart. The convergence to two key metrics pointing to support being offered in this price range.
- Price Target 1: 1.07598 – Month-to-date price high printed on 15th March.
- Price Target 1: 1.1033 – In extension, year-to-date price high printed on 1st February. Also, near to the psychologically important 1.10 price level.
- Stop Loss: <1.05161 – Price low of 15th March.
Indices
S&P 500
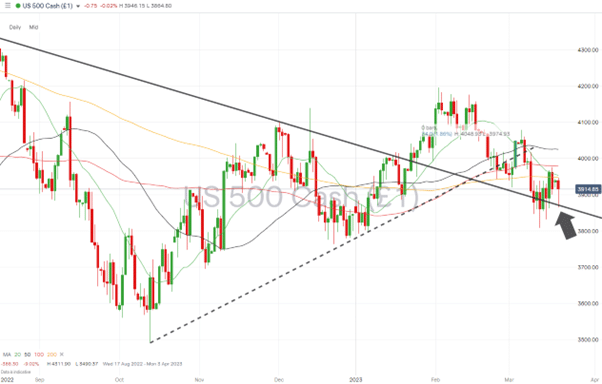
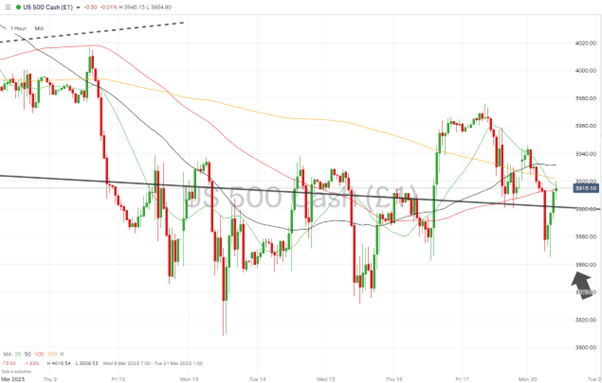
The collapse of SVB and risk of other bigger banks being exposed resulted in the S&P 500 index last week underperforming the tech-stock heavy Nasdaq 100 index. Near-term price moves look set to be driven by whether the finance sector is considered robust enough to ride out the current storm and the interest rate announcement made by the Fed on Wednesday.
S&P 500 Chart – Daily Price Chart – Trendline Support
Source: IG
S&P 500 – Hourly Price Chart – Trendline Support
Source: IG
Short positions
- Entry Level 1: 3,978 – Region of 100 SMA on the Daily Price Chart. Acted as resistance on Friday 17th March.
- Price Target 1: 3,947 – 200 SMA on Daily Price Chart.
- Price Target 2: 3,865 – Intraday price low of Monday 20th March. The bounce off the multi-month trendline points to that metric now providing support rather than resistance.
- Stop Loss: > 4,024 – Region of 50 SMA on the Daily Price Chart, which sits just above the ‘round number’ resistance offered by the 4,000-price level.
Long positions
- Entry Level 1: 3,865 – Multi-month trendline support.
- Price Target 1: 3,947 – Convergence of the 20 and 200 SMA on Daily Price Chart.
- Price Target 2: 4,078 – Price high of 6th March 2023.
- Stop Loss: < 3,763 – Price low of 22nd December 2022. A break of this level would signify the end of the bullish price pattern, which started forming on 13th October 2022.
Crypto – Bitcoin & Ethereum
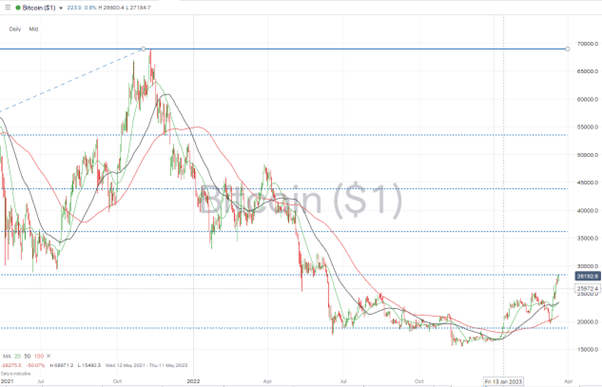
Concern about the health of mainstream banks triggered a rush into crypto assets, with Bitcoin posting a weekly gain of +27% and Ethereum increasing in value by +12%.
Bitcoin Price Chart – Daily Price Chart – With Fib
Source: IG
Bitcoin Long positions
- Entry Level 1: 28,409 – Price level of 61.8% Fib retracement level of the upward price move in Bitcoin recorded between February 2019 and November 2021.
- Price Target 1: 30,000 – Round number price level.
- Price Target 2: 36,154 – 50% Fib level of the same price move.
- Stop Losses: < 23,400 – Region of 50 SMA (and 20 SMA) on Daily Price Chart.
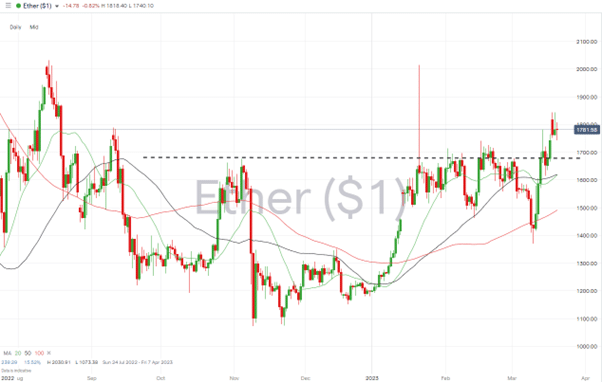
Ethereum
Ethereum Chart – Daily Price Chart
Source: IG
Ethereum Long positions
- Entry Level 1: 1,676 – Buying into any weakness which takes price back to level which formerly offered resistance and now provides support. Price high of 4th November 2022.
- Price Target 1: 2,000 – Psychologically important price level previously tested on 14th August 2022.
- Stop Losses: < 1,618 – Region of the 20 and 50 SMAs which have converged.
Risk Statement: Trading financial products carries a high risk to your capital, especially trading leverage products such as CFDs. They may not be suitable for everyone. Please make sure that you fully understand the risks. You should consider whether you can afford to take the risk of losing your money.

Forextraders' Broker of the Month
BlackBull Markets is a reliable and well-respected trading platform that provides its customers with high-quality access to a wide range of asset groups. The broker is headquartered in New Zealand which explains why it has flown under the radar for a few years but it is a great broker that is now building a global following. The BlackBull Markets site is intuitive and easy to use, making it an ideal choice for beginners.