
FOCUS ON: Banking Sector Aftershocks
- Collapse of SVB and Credit Suisse has brought the banking sector back into the spotlight.
- In a week with few major announcements, news flow from the finance sector can be expected to drive price volatility.
- Forex markets poised with some currencies forming consolidatory price patterns in preparation for their next move.
Trading Ideas
We have created this Weekly Tips section to share the possible trade entry and exit points based on our technical analysis. All our trades include entry, and at least one target price. Stop losses are applied at the reader’s discretion. Our strategies typically trade with a wide stop loss, and risk is further mitigated by trading in small sizes.
Instrument | Price | Hourly | Daily |
GBP/USD | 1.2243 | Neutral | Strong Buy |
EUR/USD | 1.0763 | Strong Sell | Strong Buy |
USD/JPY | 131.28 | Neutral | Strong Sell |
S&P 500 | 3,987 | Strong Buy | Neutral |
NASDAQ 100 | 12,788 | Strong Buy | Strong Buy |
FTSE100 | 7,469 | Strong Sell | Strong Sell |
Gold | 1,968 | Strong Sell | Strong Buy |
Crude Oil WTI | 70.07 | Buy | Strong Sell |
Bitcoin | 27,816 | Neutral | Buy |
Ethereum | 1,752 | Sell | Buy |
UTC: 09:20
US Dollar Basket Index (DXY)
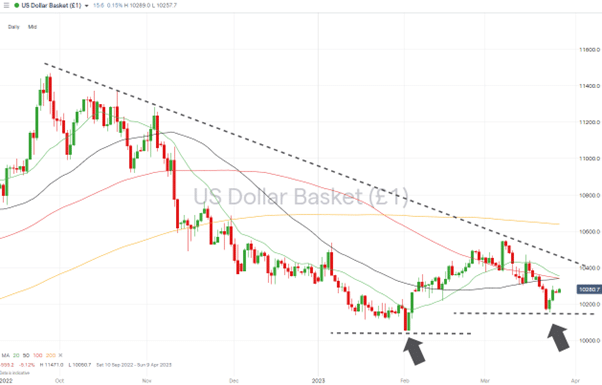
Price moves in the US Dollar Basket Index set the tone for the entire Forex market last week. There was an immediate reaction to the announcement by Jerome Powell of the US Federal Reserve, who claimed that the fact that US interest rates were ‘only’ going up by 25 basis points was indicative of a shift into risk-on currencies. Soon after, a price reversal was brought about by fears that German banking giant Deutsche Bank could be the next financial giant to come under pressure.
With the next major US news announcement being the Nonfarm Payroll employment report on 7th April, there are now two weeks for Forex traders to catch short-term price moves triggered by news from the banking sector.
US Dollar Basket Chart – Daily Price Chart – Key Support Levels
Source: IG
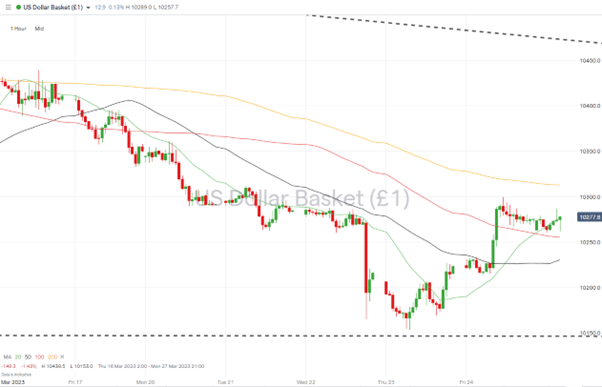
US Dollar Basket Chart – Hourly Price Chart
Source: IG
Short positions
- Entry Level 1: 101.53 – The ‘swing-low’ of 101.53 printed on Thursday 23rd March is a key price level. A break below that support opens the door to further downwards movement and a test of the year-to-date low.
- Price Target 1: 100.51 – Year-to-date price low printed on 2nd February, and just above psychologically important 100.00 price level.
- Stop Loss: >103.40 – Region of the convergence of 50 and 100 SMAs on the Daily Price Chart.
Long positions
Entry Level 1: 101.53 – The long-term trendline dating from September 2022 offers significant resistance in the region of 104.50. Strategies looking to trade long positions could do well to wait for price weakness, which offers trade entry points in the region of last week’s swing-low.
- Price Target 1: 103.40 – Region of the convergence of 50 and 100 SMAs on the Daily Price Chart.
- Price Target 2: 104.50 – Upper trendline of downwards channel formed in September 2022.
- Stop Loss: < 100.51 – Year-to-date price low of 2nd February and just above ‘round number’ 100.00 price level.
GBPUSD
The Bank of England’s decision to raise interest rates by 25 basis points last week opened up a debate about when that policy might pivot. Forecasts point to inflation falling dramatically by the end of the year, while current data readings show near-term inflation is running away.
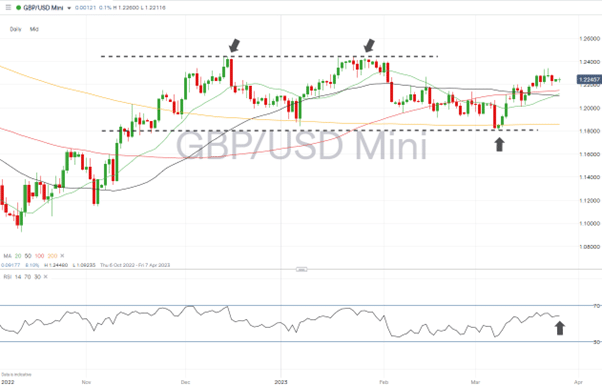
Uncertainty about the BoE’s future policy has left GBPUSD trading mid-range in a long-term price channel. With the RSI on the Daily Price Chart at 58, the market is neither ‘overbought’ or ‘oversold’ which leaves room for price to move in either direction before meeting any significant resistance.
Daily Price Chart – GBPUSD Chart – Daily Price Chart
Source: IG
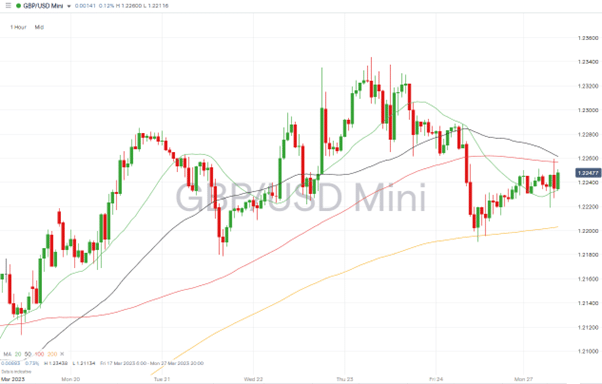
GBPUSD Chart – Hourly Price Chart
Source: IG
Short positions
- Entry Level 1: 1.2151 – Region of the 100 SMA on the Daily Price Chart.
- Price Target 1: 1.20105 – Price low of 15th March, which bounced off the 20 SMA on Daily Price Chart and just above the psychologically important 1.20 price level.
- Price Target 2: 1.180306 – Year-to-date price low recorded on 8th March.
- Stop Loss: > 1.23434 – Multi-week price high printed on 23rd March.
Long positions
- Entry Level 1: 1.21035 – Buying into weakness, at the point where the convergence of the 20, 50, and 100 SMAs on the Daily Price Chart points GBPUSD finding support.
- Price Target 1: 1.22156 – The 61.8% Fibonacci retracement price level of the price fall between 14th December 2022 and 6th January 2023.
- Price Target 2: 1.24480 – In extension, year-to-date price high printed on 23rd January 2023.
- Stop Loss: < 1.20105 – Price low of 15th March and the region of the psychologically important 1.20 price level.
EURUSD
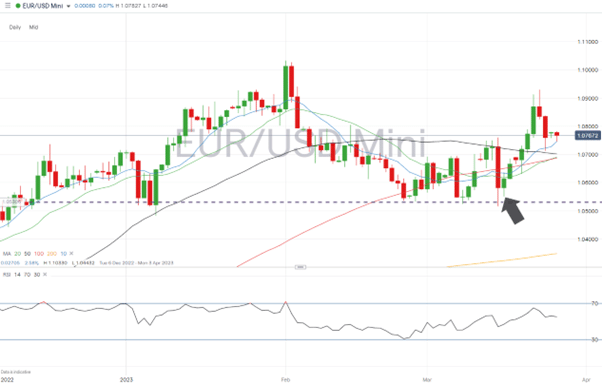
The suggestion that the US Fed might be adopting a more ‘dovish’ policy triggered a rise in the price of EURUSD. The ECB outlined in its latest announcement that the ‘hawkish’ policy is very much a part of its agenda, and so liquid assets flocked to the euro.
Banking concerns, specifically relating to Deutsche Bank, have resulted in selling pressure. However, with the RSI on the Daily Price Chart trading mid-range at 54, there is room for price to move in either direction. The most likely catalyst is further news regarding the health of the eurozone banking sector.
EURUSD Chart – Daily Price Chart
Source: IG
EURUSD Chart – Hourly Price Chart
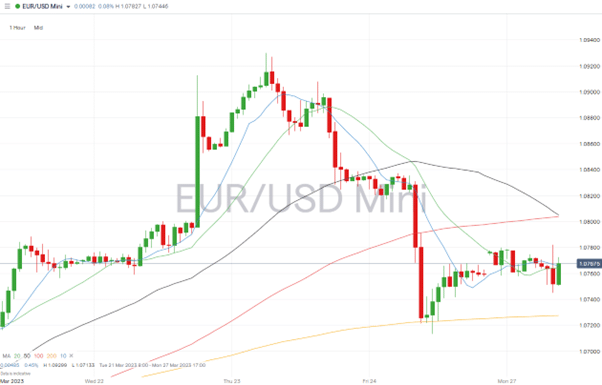
Source: IG
Short positions
- Entry Level 1: 1.07460 – Region of 10 SMA on the Daily Price Chart. Price hasn’t closed below this metric since 16th March. Trading with a momentum-based strategy if the price shows short-term weakness.
- Price Target 1: 1.0700 – Round number price level and price point where 20, 50, and 100 SMAs on the Daily Price Chart are converging.
- Price Target 2: 1.06114 – Level of 38.2% Fib retracement of the EURUSD price fall between January 2021 and September 2022.
- Price Target 3: 1.05161 – Price low of 15th March.
- Stop Loss: > 1.09299 – Price high of Thursday 23rd March.
Long positions
- Entry Level 1: 1.0700– Buying into short-term weakness in the region of 20, 50, and 100 SMAs on Daily Price Chart.
- Price Target 1: 1.09299 – Month-to-date price high printed on 23rd March.
- Price Target 1: 1.1033 – In extension, year-to-date price high printed on 1st February. Also, near to the psychologically important 1.10 price level where profit-taking can be expected to take place.
- Stop Loss: <1.05161 – Price low of 15th March.
Indices
S&P 500
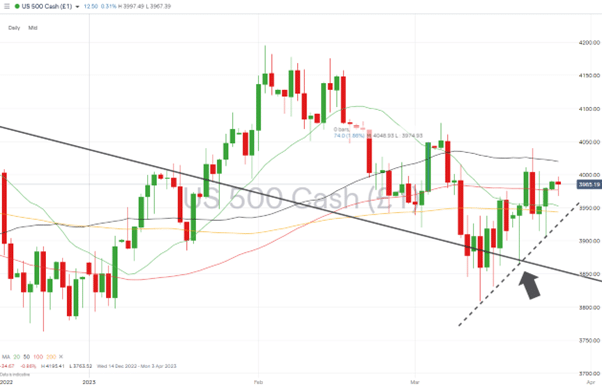
US stocks managed to shrug off concerns about the Eurozone and Swiss banking sectors with the S&P 500 index posting a +2.5% week-on-week return.
The long lower tails on the candles of the Daily Price Chart demonstrate the level of volatility. This is still a dominant feature of stock markets. The supporting trendline holds the path of least resistance continues to appear to be upwards.
S&P 500 Chart – Daily Price Chart – Trendline Support
Source: IG
S&P 500 – Hourly Price Chart – Trendline Support
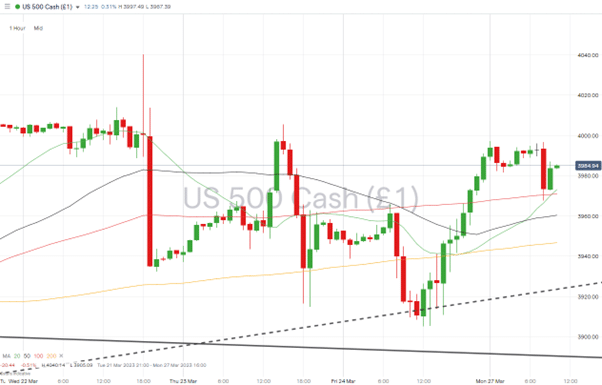
Source: IG
Short positions
- Entry Level 1: 4,019 – Selling into strength which takes price into the region of the 4,000 round number price level and the region of 50 SMA on Daily Price Chart.
- Price Target 1: 3,976 – Region of the 100 SMA on Daily Price Chart.
- Price Target 2: 3,943 – Supporting trendline of the rally which started on 13th March, and region of the 200 SMA on the Daily Price Chart.
- Stop Loss: >4,078 – Price high of 6th March.
Long positions
- Entry Level 1: 3,976 – Region of the 100 SMA on Daily Price Chart. Was a key price support/resistance level between 24th February and 9th March.
- Price Target 1: 4,000 – Psychologically important price level.
- Price Target 2: 4,019 – Region of 50 SMA on Daily Price Chart.
- Stop Loss: <3,943 – Supporting trendline of the rally which started on 13th March, and region of the 200 SMA on the Daily Price Chart.
Crypto – Bitcoin & Ethereum
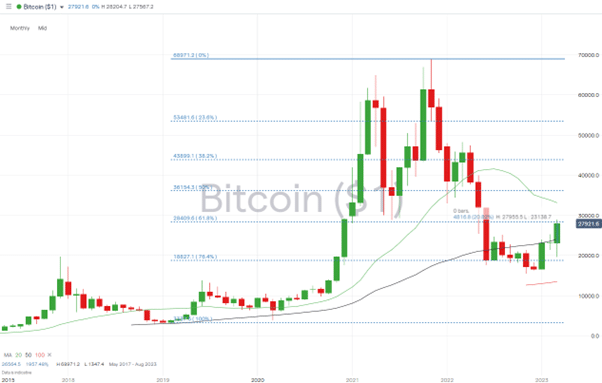
March has been a good month for cryptocurrencies. Spurred on by concerns about the conventional banking sector, BTC has gained 20.83% in value and ETH 9.79%. The last week has seen the price chart in both coins form consolidation patterns with the next move, which is likely to be determined by news about the health of major banks.
Bitcoin Price Chart – Monthly Price Chart – with Fib
Source: IG
Bitcoin Long positions
- Entry Level 1: 28,409 – Price level of 61.8% Fib retracement level of the upwards price move in Bitcoin recorded between February 2019 and November 2021. A break of this resistance level would open the door to further upwards price action.
- Price Target 1: 30,000 – Round number price level.
- Price Target 2: 36,154 – 50% Fib level of the same price move.
- Stop Losses: < 25,319 – Region of 20 SMA on Daily Price Chart.
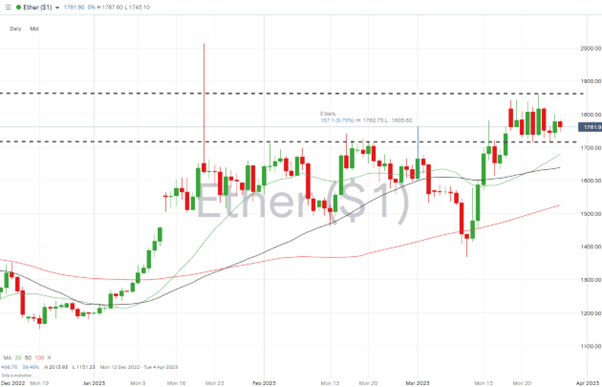
Ethereum
Ethereum Chart – Daily Price Chart
Source: IG
Ethereum Long positions
- Entry Level 1: 1,715 – Buying into any weakness which takes price back to resistance/support level marked by the lower trendline of the sideways trading channel. Price low of 22nd March.
- Price Target 1: 2,000 – Psychologically important price level previously tested on 14th August 2022.
- Stop Losses: <1,679 – Region of the 20 SMA on the Daily Price Chart.
Risk Statement: Trading financial products carries a high risk to your capital, especially when trading leveraging products such as CFDs. These products may not be suitable for everyone. Please make sure that you fully understand the risks; you should consider whether you can afford to take the risk of losing the money that you may invest.

Forextraders' Broker of the Month
BlackBull Markets is a reliable and well-respected trading platform that provides its customers with high-quality access to a wide range of asset groups. The broker is headquartered in New Zealand which explains why it has flown under the radar for a few years but it is a great broker that is now building a global following. The BlackBull Markets site is intuitive and easy to use, making it an ideal choice for beginners.