FOCUS ON: Big Week in Terms of Economic Data Releases
- Central bank interest rate decisions and US (NFP) job numbers mark a busy week in terms of data releases.
- This comes after major US stock indices posted a second successive positive quarterly performance.
- Talk of a new bull market forming leaves investors shaken by 2022’s sell-off and worrying about FOMO.
Trading Ideas
We created this Weekly Tips section to share possible trade entry and exit points based on our technical analysis. We also have other methods to validate our trades which we can’t publicly share that help to increase their success. All our trades include entry and at least one target price. Stop losses are applied at the reader’s discretion. Our strategies typically trade with a wide stop loss, and risk is further mitigated by trading in small sizes.
Instrument | Price | Hourly | Daily |
GBP/USD | 1.2318 | Neutral | Strong Buy |
EUR/USD | 1.0836 | Neutral | Strong Buy |
USD/JPY | 133.50 | Strong Buy | Strong Buy |
S&P 500 | 4,101 | Strong Buy | Strong Buy |
NASDAQ 100 | 13,099 | Strong Buy | Strong Buy |
FTSE100 | 7,680 | Strong Buy | Strong Buy |
Gold | 1,959 | Strong Sell | Buy |
Crude Oil WTI | 79.72 | Strong Buy | Strong Buy |
Bitcoin | 27,852 | Neutral | Buy |
Ethereum | 1,788 | Buy | Strong Buy |
UTC: 09:48
US Dollar Basket Index (DXY)
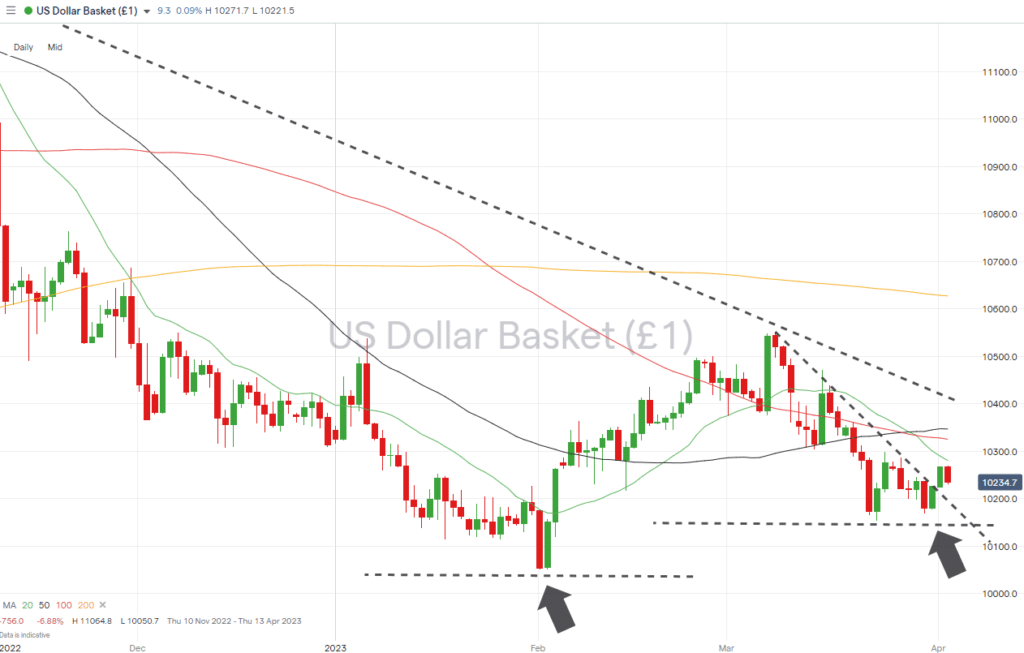
The wedge pattern forming on the US Dollar Basket index Daily Price Chart still holds after the greenback spent a week trading within a relatively tight price range. Last week’s high and low price points were 102.86 and 101.68, respectively, which leaves traders with no clear sign as to whether it is long-term support or resistance levels which will next be tested.
Friday sees the release of the US jobs data for March. That milestone of the trading month will fall on Good Friday when many exchanges will be closed for the Easter holiday. The possibility of that number hitting the markets during lower-than-normal trading volumes could result in heightened price volatility.
US Dollar Basket Chart – Daily Price Chart – Wedge Pattern Forming
Source: IG
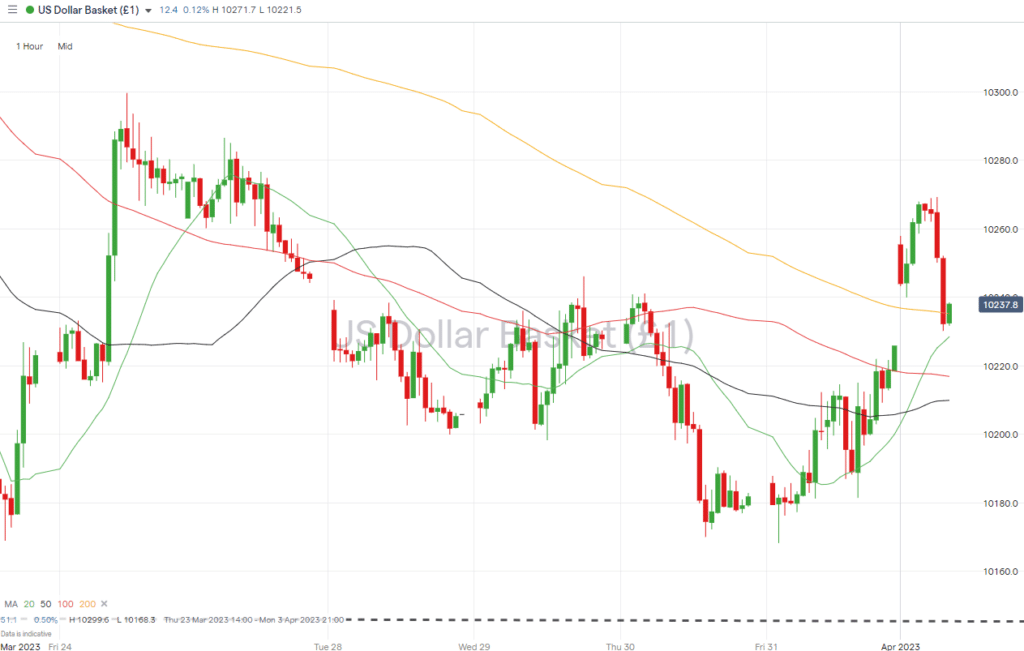
US Dollar Basket Chart – Hourly Price Chart
Source: IG
Short positions
- Entry Level 1: 102.99 – Price high of Friday 24th March. Close to the psychologically important 103.00 price level and the region of the 20 SMA on the Daily Price Chart (102.80).
- Price Target 1: 101.77 – Intraday low of Friday 31st March, and region of the support/resistance trendline dating from 8th March.
- Price Target 2: 101.53 – Monthly price-low, printed on 23rd March.
- Stop Loss: > 103.25 – Region of the convergence of 50 and 100 SMAs on the Daily Price Chart.
Long positions
- Entry Level 1: 102.80 – Any suggestion that the US Non-Farm Payroll jobs number might mean the US Fed’s monetary policy will have to remain hawkish could trigger another rally in the US dollar. A momentum-based strategy could be applied if price breaks above the 20 SMA on the Daily Price Chart – a metric which has provided stiff resistance since 16th March.
- Price Target 1: 103.46 – Region of the 50 SMA on the Daily Price Chart.
- Price Target 2: 104.07 – Upper trendline of the downward channel formed in September 2022.
- Stop Loss: < 101.53 – Support level formed by price low of 23rd March.
GBPUSD
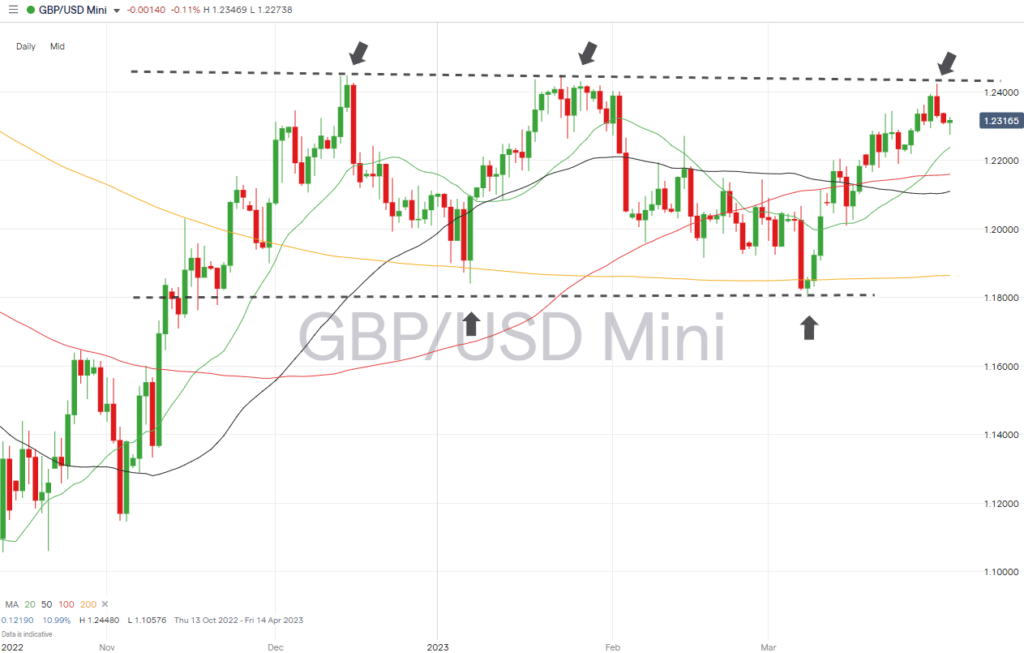
Sterling’s weekly price gain of 0.61% was enough to take the price of GBPUSD up to 1.2423 and a test of the ‘double-top’ formation formed by the price highs of December 2022 and January 2023.
With the RSI on the Daily Price Chart at 58.5, the market is far from being ‘overbought’ on that timeframe, which leaves room for a further rally and break of the resistance offered by the top trendline of the multi-month sideways trading channel.
Daily Price Chart – GBPUSD Chart – Daily Price Chart
Source: IG
GBPUSD Chart – Hourly Price Chart
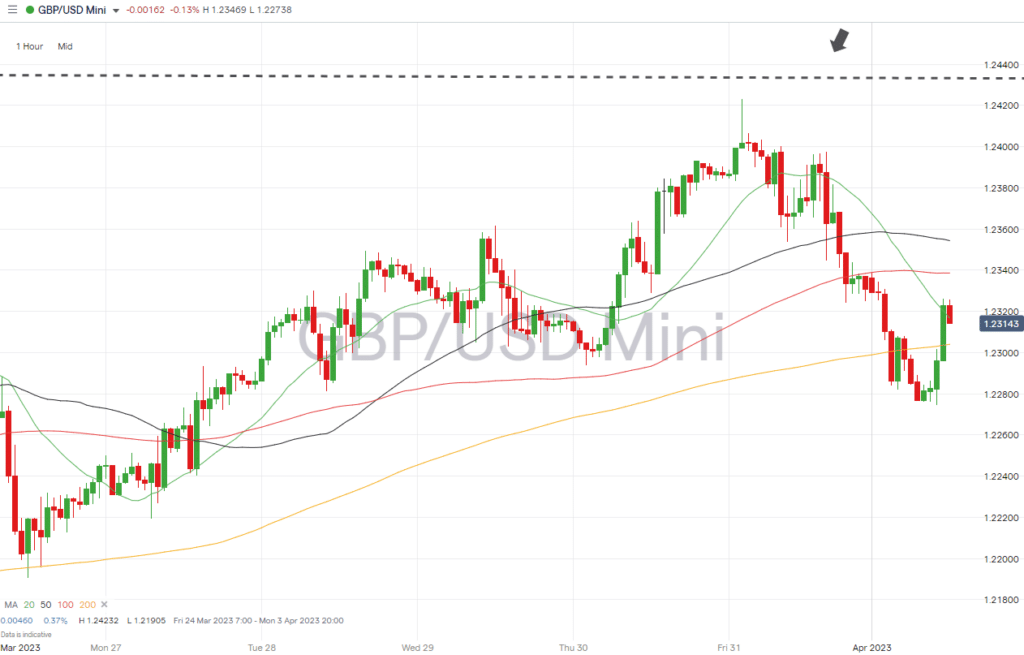
Source: IG
Short positions
- Entry Level 1: 1.24232 – Resistance level that has capped GBPUSD price moves since December 2022.
- Price Target 1: 1.22377 – Region of the 20 SMA on Daily Price Chart. Close to 1.22156 marks the 61.8% Fibonacci retracement price level of the price fall between 14th December 2022 and 6th January 2023.
- Price Target 2: 1.2015 – Swing-low price low of 15th March and close to 1.20 ‘round number’ support level.
- Stop Loss: > 1.250 – Round number price level.
Long positions
- Entry Level 1: 1.24232 – Using a breakout strategy which captures further upwards momentum.
- Price Target 1: 1.24480 – Year-to-date price high printed on 23rd January 2023.
- Price Target 2: 1.25466 – Region of the 20 SMA on the Monthly Price Chart.
- Stop Loss: < 1.22745 – April month-to-date price low printed on 3rd April.
EURUSD
The path of least resistance for EURUSD continues to appear upward, but bulls need to factor in the price resistance between 1.09264 and the psychologically important 1.10 price level.
EURUSD Chart – Daily Price Chart
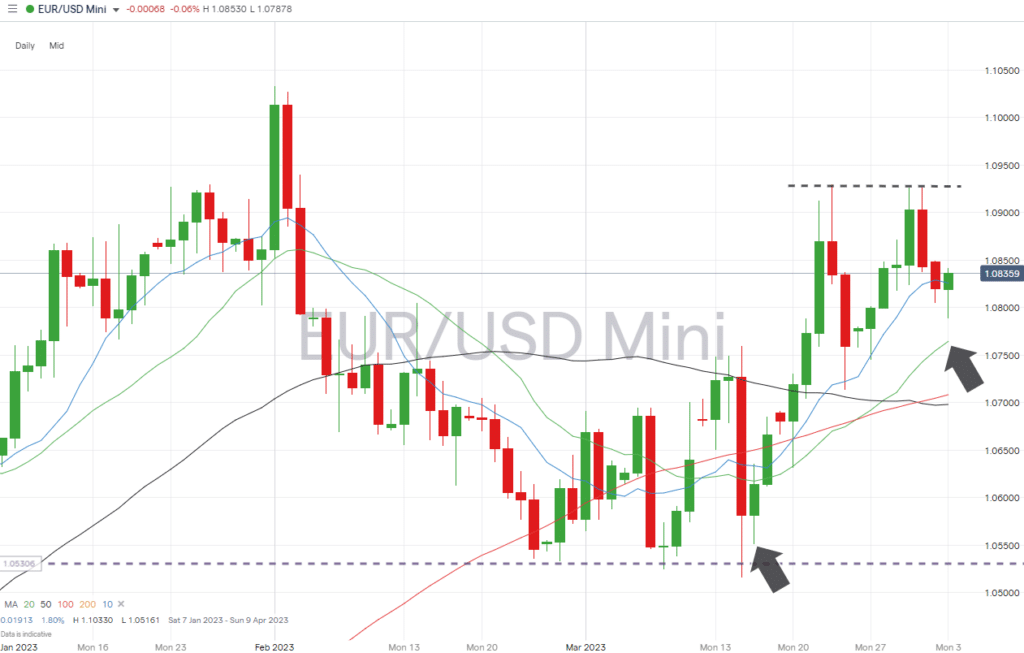
Source: IG
EURUSD Chart – Hourly Price Chart
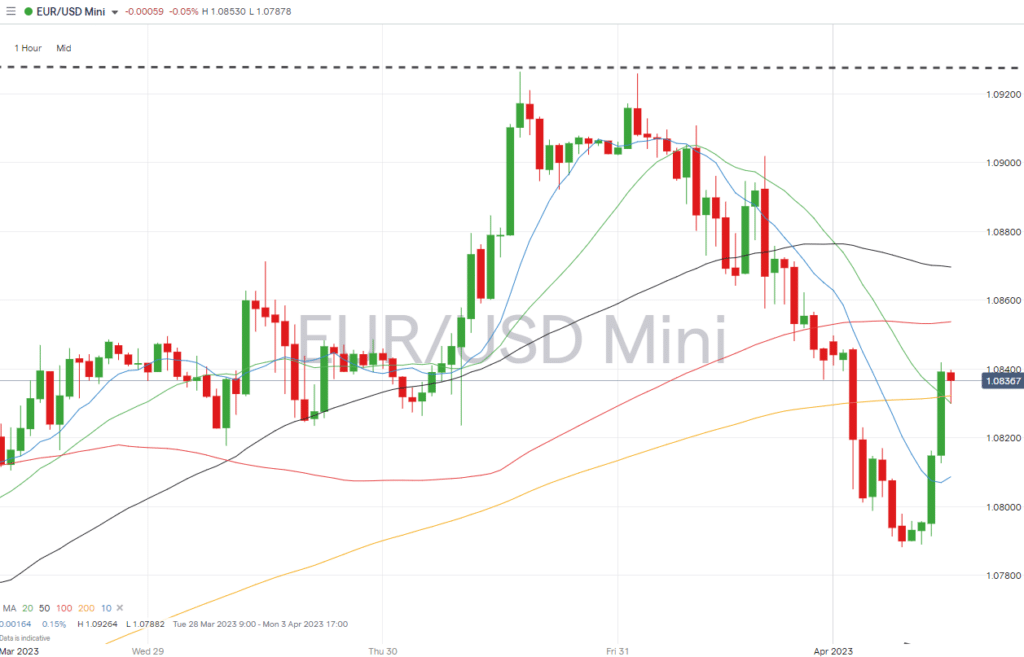
Source: IG
Short positions
- Entry Level 1: 1.09258 – Intraday price high printed on 31st March.
- Price Target 1: 1.08273 – Region of the 10 SMA on the Daily Price Chart, which has guided price since mid-March.
- Price Target 2: 1.06114 – The 38.2% Fib retracement price level marked by the EURUSD price fall between January 2021 and September 2022.
- Price Target 3: 1.05161 – In extension, price low of 15th March.
- Stop Loss: > 1.1033 – In extension, year-to-date price high printed on 1st February.
Long positions
- Entry Level 1: 1.07651 – Any weakness which takes price towards the region of the 20 SMA on the Daily Price Chart would trigger buying action from Eurodollar bulls.
- Price Target 1: 1.09299 – March price high printed on 23rd March.
- Price Target 2: 1.1000 – ‘Round number’ resistance offered by the 1.10 price bar.
- Stop Loss: <1.07086 – Convergence of 50 and 100 SMAs on the Daily Price Chart.
Indices
S&P 500
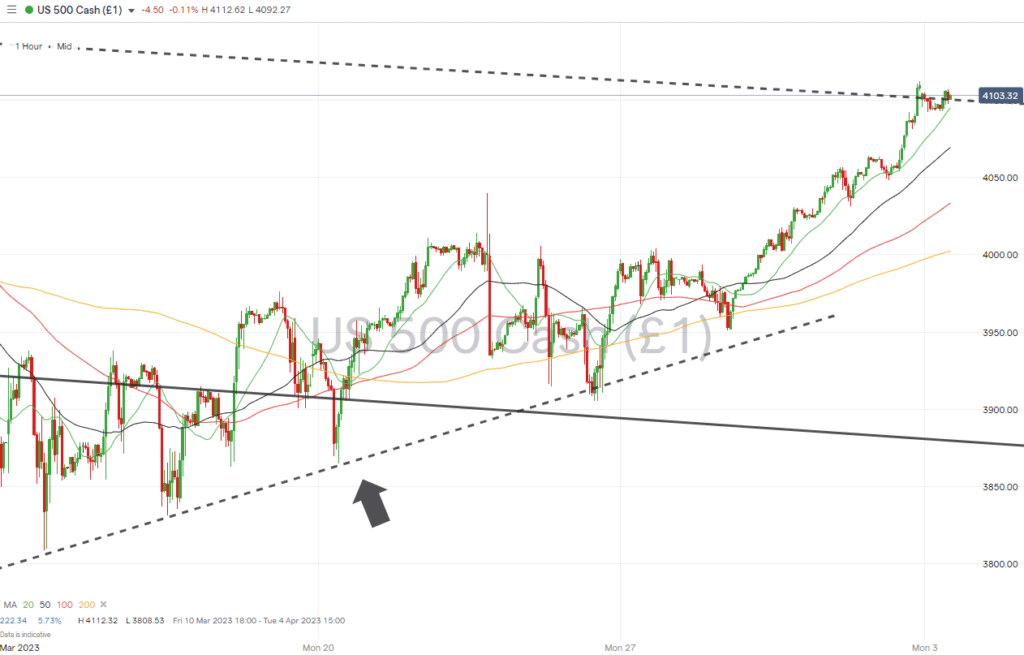
Major US stock indices have posted positive returns over two successive quarters. That has opened a debate about whether this is the start of a new bull market rather than a retracement of the 2022 bear market.
The price high of 4195 printed in February 2023 looks like an increasingly important metric. That price level represents a +20% price gain from the price-low of October 2022 (3490), with a +20% gain being another widely accepted defining term of a bull market.
S&P 500 Chart – Daily Price Chart – Trendline Support
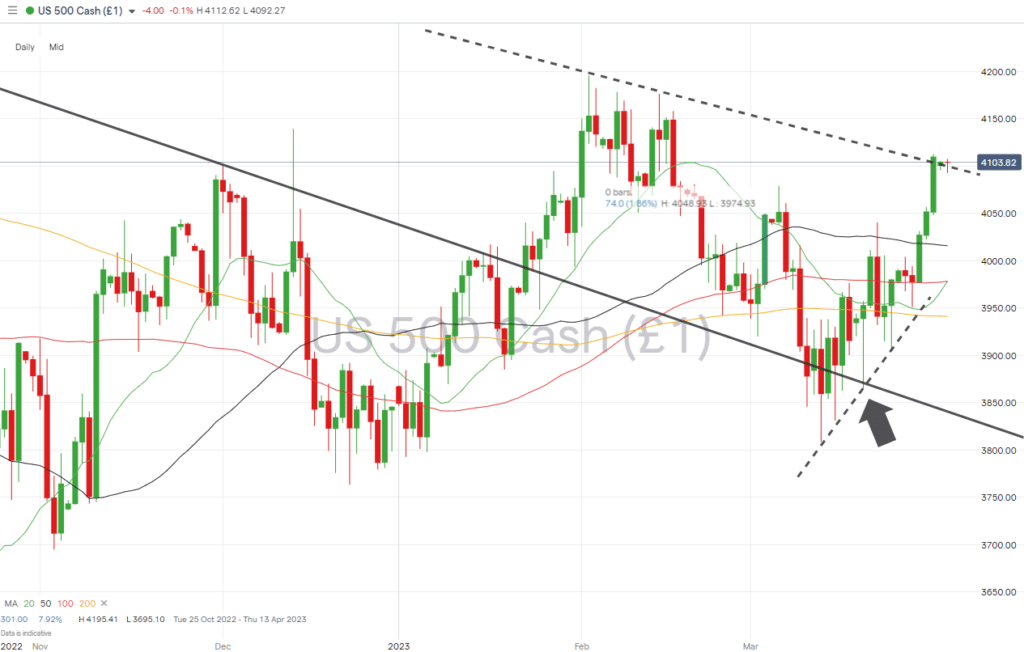
Source: IG
S&P 500 – Hourly Price Chart – Trendline Support
Source: IG
Short positions
- Entry Level 1: 4,100 – Selling into strength which takes price into the region of the resistance trendline marked by the price highs of 2nd and 14th February.
- Price Target 1: 4,015 – Region of the 50 SMA on Daily Price Chart.
- Price Target 2: 3,940 – Region of the 200 SMA on the Daily Price Chart.
- Stop Loss: > 4,175 – Price high of 14th February 2023.
Long positions
- Entry Level 1: 3,978 – A return to, and test of, the psychologically important 4,000 price level would open the door to those looking to enter long positions in the region of the 100 SMA on the Daily Price Chart.
- Price Target 1: 4,015 – Region of 50 SMA on Daily Price Chart.
- Price Target 2: 4,112 – Price high of 31st March 2023.
- Stop Loss: < 3,940 – Supporting trendline of the rally, which started on 13th March and region of the 200 SMA on the Daily Price Chart.
Crypto – Bitcoin & Ethereum
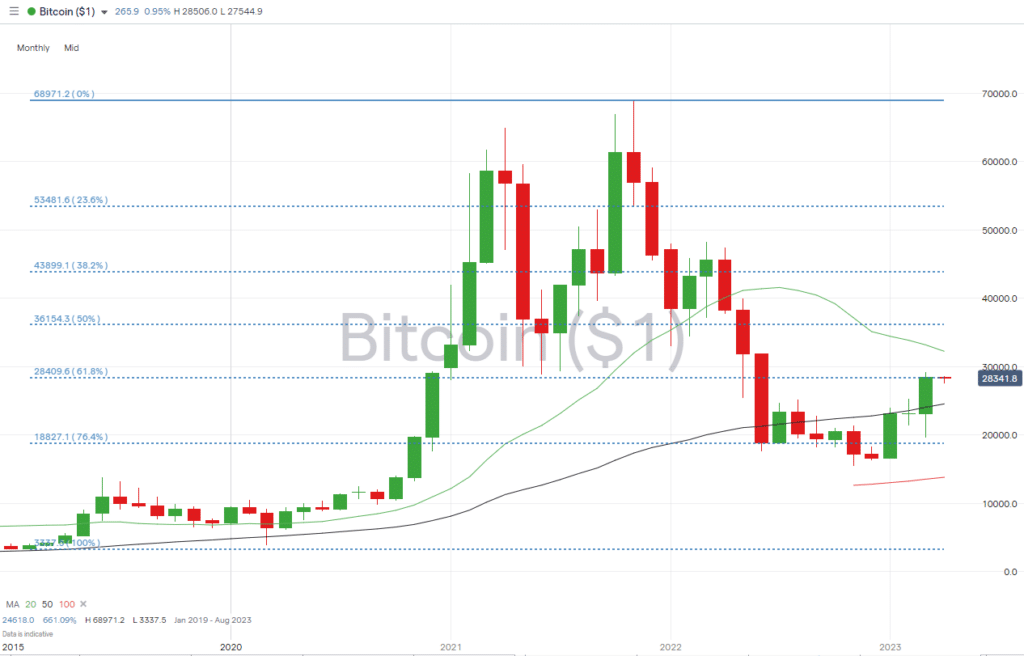
Both the major cryptocurrencies posted significant gains in March. In reaction to concerns about the conventional banking sector, BTC and ETH posted monthly returns of 22.68% and 9.79%, respectively.
April has seen the cryptos start out trading consolidation patterns and waiting for SMAs to catch up with price.
Bitcoin Price Chart – Monthly Price Chart – with Fib
Source: IG
Bitcoin Long positions
- Entry Level 1: 28,409 – Price level of the 61.8% Fib retracement level formed by the upwards price move in BTC recorded between February 2019 and November 2021. A break of this significant and long-term resistance level would open the door to further upwards price action.
- Price Target 1: 30,000 – Round number price level.
- Price Target 2: 36,154 – 50% Fib level of the same price move.
- Stop Losses: < 27,505 – Region of 20 SMA on Daily Price Chart.
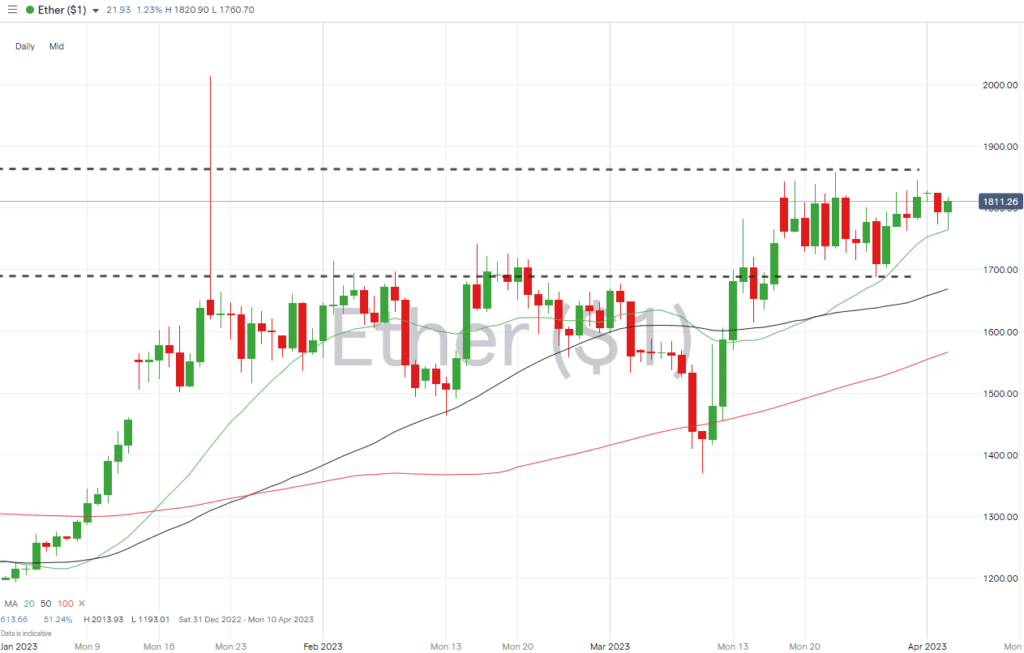
Ethereum
Ethereum Chart – Daily Price Chart
Source: IG
Ethereum Long positions
- Entry Level 1: 1,764 – Buying into any weakness that takes price back to the resistance/support level offered by the 20 SMA on the Daily Price Chart.
- Price Target 1: 2,000 – Psychologically important price level previously tested on 14th August 2022.
- Stop Losses: < 1,687 – Price low of Monday 27th March.
Risk Statement: Trading financial products carries a high risk to your capital, especially trading leverage products such as CFDs. They may not be suitable for everyone. Please make sure that you fully understand the risks. You should consider whether you can afford to take the risk of losing your money.

Forextraders' Broker of the Month
BlackBull Markets is a reliable and well-respected trading platform that provides its customers with high-quality access to a wide range of asset groups. The broker is headquartered in New Zealand which explains why it has flown under the radar for a few years but it is a great broker that is now building a global following. The BlackBull Markets site is intuitive and easy to use, making it an ideal choice for beginners.