
FOCUS ON: US Inflation Report and Start of Earnings Season Due as Market Sentiment Turns Bullish
- Risk appetite returns to markets, with forex, stock, commodity, and crypto indicators shifting to ‘Strong Buy’.
- US CPI inflation numbers and the first batch of earnings season numbers are due to be released.
- Price volatility levels can be expected to remain high as traders evaluate whether central banks are about to pivot from hawkish to dovish interest rate policies.
Trading Ideas
We created this Weekly Tips section to share possible trade entry and exit points based on our technical analysis. We also have other methods to validate our trades which we can’t publicly share that help to increase their success. All our trades include entry and at least one target price. Stop losses are applied at the reader’s discretion. Our strategies typically trade with a wide stop loss, and risk is further mitigated by trading in small sizes.
Instrument | Price | Hourly | Daily |
GBP/USD | 1.2424 | Strong Buy | Strong Buy |
EUR/USD | 1.0894 | Strong Buy | Strong Buy |
USD/JPY | 133.22 | Sell | Strong Buy |
S&P 500 | 4,112 | Strong Buy | Strong Buy |
NASDAQ 100 | 13,062 | Strong Buy | Strong Buy |
FTSE100 | 7,782 | Strong Buy | Strong Buy |
Gold | 2,001 | Strong Buy | Strong Buy |
Crude Oil WTI | 80.44 | Strong Buy | Strong Buy |
Bitcoin | 30,060 | Strong Buy | Strong Buy |
Ethereum | 1,919 | Strong Buy | Strong Buy |
UTC: 09:32
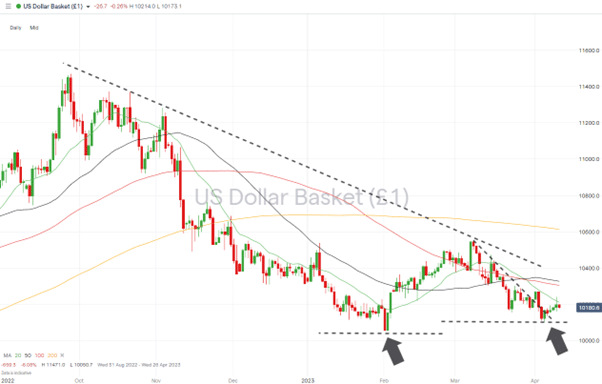
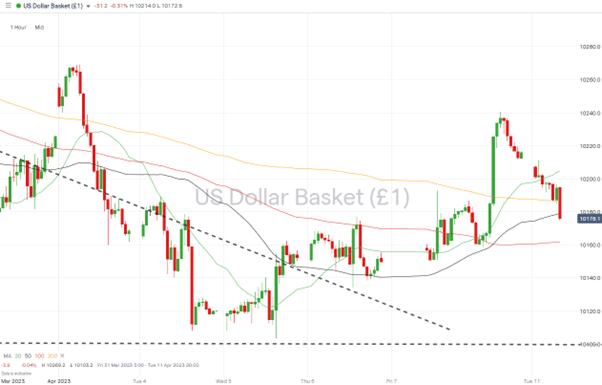
US Dollar Basket Index (DXY)
The US Dollar Basket index price has been forming a consolidation pattern since 22nd March, which continues to funnel price into the end of a forming wedge pattern. The index spent last week trading between 101.03 and 102.69 and finished the trading week mid-range at 101.80.
This week’s US CPI inflation data, due on Wednesday, could act as a catalyst and take price through the support and resistance levels marked by last week’s price low and high. Any surprises regarding the rate of US price rises could determine if the US Fed is indeed at a point where it decides to pivot its interest rate policy from a hawkish to a dovish stance.
US Dollar Basket Chart – Daily Price Chart – Wedge Pattern Forming
Source: IG
US Dollar Basket Chart – Hourly Price Chart – Rangebound
Source: IG
Short positions
- Entry Level 1: 102.69 – Price high of Monday 3rd April. Friday 24th March. Close to the psychologically important 103.00 price level and the 100 SMA on the Daily Price Chart (103.04).
- Price Target 1: 102.09 – Region of the 20 SMA on the Daily Price Chart.
- Price Target 2: 101.03 – Month-to-date price-low, printed on 5th April.
- Stop Loss: > 103.25 – Region of the convergence of 50 SMA on the Daily Price Chart.
Long positions
- Entry Level 1: 102.69 – The DXY index has been forming a bearish price pattern since Q4 of 2022. If the US CPI number contains enough surprises for that to reverse, then a momentum-based strategy could be applied if price breaks above the high printed on 3rd April.
- Price Target 1: 103.04 – Region of the 100 SMA on the Daily Price Chart and ‘round number’ resistance at 103.00.
- Price Target 2: 103.54 – Upper trendline of the downward channel formed by bearish price action since September 2022.
- Stop Loss: < 102.09 – Region of the 20 SMA on the Daily Price Chart.
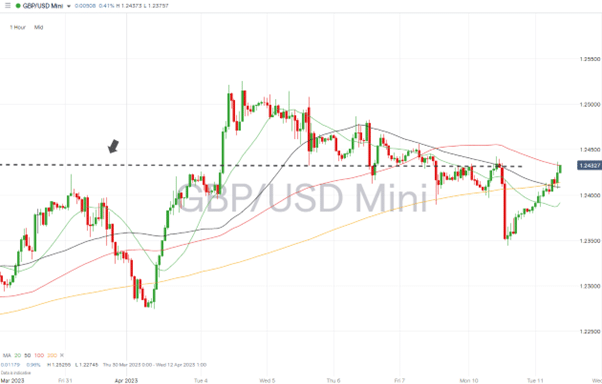
GBPUSD
The UK’s GDP numbers for February are due to be released on Thursday 13th April, with analysts forecasting economic growth to have been -0.1%. Fears of the UK entering a recession remain, and the Bank of England has shown little sign of slowing down on its policy of consistently increasing interest rates by 25 basis points.
Sterling can be expected to gain in value if the GDP number beats estimates and shows the UK economy actually expanded. That would leave room for further interest rate rises to be put in place to tackle runaway inflation of over 10%.
If the GDP number shows the economy contracted to a greater extent than expected, then a more dovish policy might be adopted by the BoE. That would open the door to GBPUSD testing the long-term price support in the region of 1.1800.
Daily Price Chart – GBPUSD Chart – Daily Price Chart
Source: IG
GBPUSD Chart – Hourly Price Chart
Source: IG
Short positions
- Entry Level 1: 1.24232 – Resistance level formed by price high of 4th April and in the region of the resistance line, which has capped GBPUSD price moves since December 2022.
- Price Target 1: 1.22156 – Price level of the 61.8% Fibonacci retracement of the price fall between 14th December 2022 and 6th January 2023.
- Price Target 2: 1.21649 – Region of a convergence by the 50 and 100 SMAs on the Daily Price Chart.
- Stop Loss: > 1.25255 – Resistance level formed by year-to-date price high of 4th April.
Long positions
- Entry Level 1: 1.25255 – Using a breakout strategy which captures further upwards momentum and pushes past the current year-to-date high and 20 SMA on the Monthly Price Chart (1.25526).
- Price Target 1: 1.27523 – Resistance offered by downward trendline dating back to May 2021.
- Price Target 2: 1.28855 – Region of a convergence by the 50 SMA on the Monthly Price Chart.
- Stop Loss: < 1.23455 – Swing-low price level recorded on 10th April.
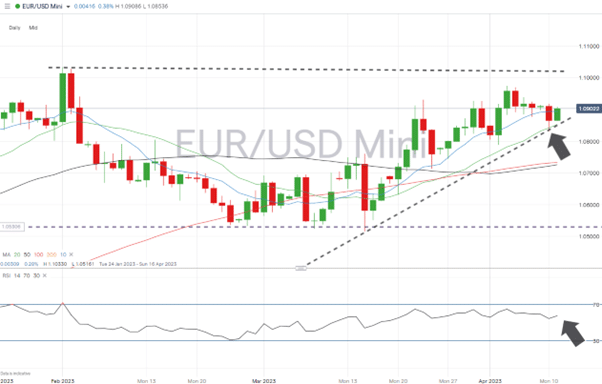
EURUSD
Price action in EURUSD since mid-March can only be described as bullish, and the recent pullback looks like an opportunity for those looking to enter long positions.
With the RSI on the Daily Price Chart at 57.8, the market is far from being ‘overbought’ on that timeframe, leaving room for further gains before the key 1.100 price level is tested.
EURUSD Chart – Daily Price Chart
Source: IG
EURUSD Chart – Hourly Price Chart
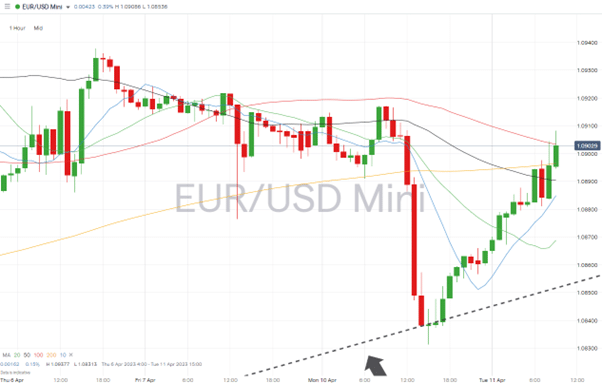
Source: IG
Short positions
- Entry Level 1: 1.08313 – A break of the swing-low printed on Monday 10th April would suggest the multi-week bullish trend is reversing.
- Price Target 1: 1.07352 – Region of the 100 SMA on the Daily Price Chart.
- Price Target 2: 1.06114 – The 38.2% Fib retracement price level marked by the EURUSD price fall between January 2021 and September 2022.
- Price Target 3: 1.05161 – In extension, price low of 15th March and bottom end of sideways trading range formed from 6th January onwards.
- Stop Loss: > 1.1033 – Year-to-date price high printed on 1st February and just above the psychologically important 1.100 price level.
Long positions
- Entry Level 1: 1.08618 – Using the supporting trendline, which dates from 15th March, as a chance to buy into short-term price weakness.
- Price Target 1: 1.09733 – Month-to-date price high, printed on 4th April.
- Price Target 2: 1.1000 – ‘Round number’ resistance offered by the 1.1000 price bar.
- Stop Loss: <1.07331 – Convergence of 50 and 100 SMAs on the Daily Price Chart.
Indices
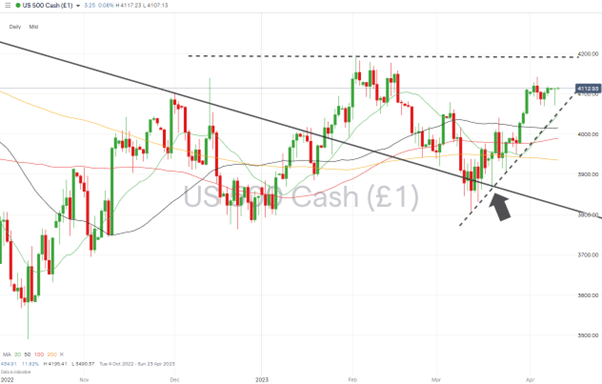
S&P 500
The S&P 500 would form a technical bull market if it could cross the 4189-price level. That means it has gained +20% in value from the price-low of October 2022 (3490). Earnings season starts this week, which could provide the stimulus needed to take stocks through and above that key resistance point.
S&P 500 Chart – Daily Price Chart – Trendline Support
Source: IG
S&P 500 – Hourly Price Chart – Trendline Support
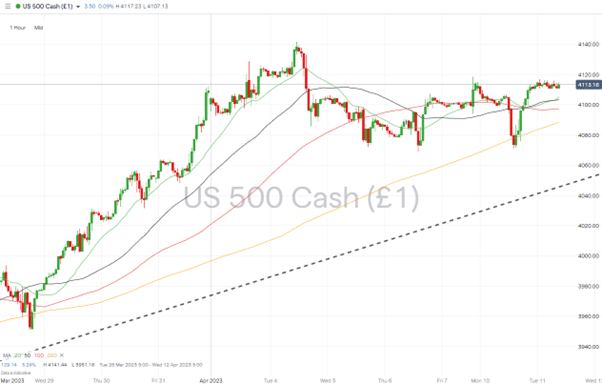
Source: IG
Short positions
- Entry Level 1: 4,141 – The S&P 500 has traded sideways over the last week. Booking short positions in the region of the price high of Tuesday 4th April could take advantage of the market appearing to have run out of steam.
- Price Target 1: 4,061 – Region of the supporting trendline of the bull-run formed since 13th March.
- Price Target 2: 4,015 – Region of the 50 SMA on Daily Price Chart.
- Stop Loss: > 4,175 – Price high of 14th February 2023.
Long positions
- Entry Level 1: 4,061 – Price weakness which takes price into the region of the multi-week supporting trendline, could offer an opportunity for those looking to go long US stocks.
- Price Target 1: 4,112 – Price high of 31st March 2023.
- Price Target 2: 4,174 – Region of 20 SMA on Monthly Price Chart.
- Stop Loss: < 4,015 – Region of the 100 SMA on the Daily Price Chart.
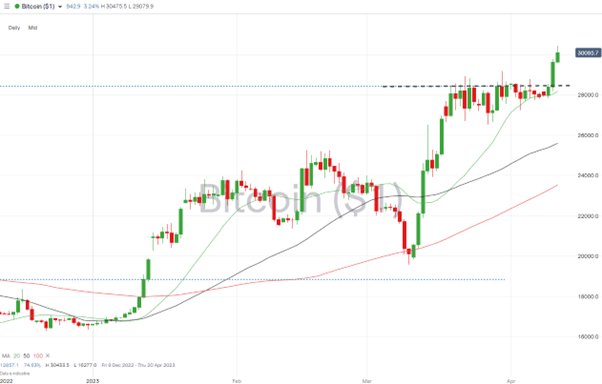
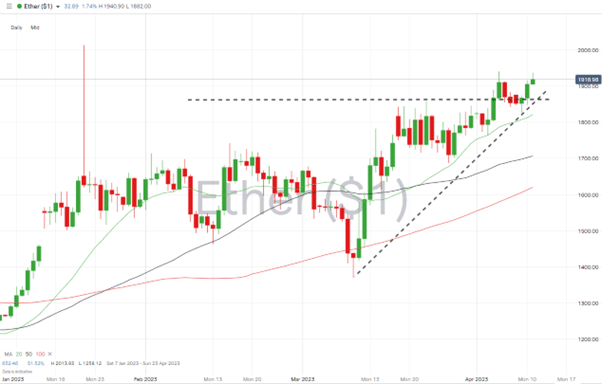
Crypto – Bitcoin & Ethereum
Bitcoin and Ethereum continue to show strength, with both coins increasing in value by +7% over the last week. The lull in price movement since mid-March now appears to have represented price catching its breath and waiting for moving averages to catch up. With that consolidation process complete, there are plausible reasons to think the 2023 bull run could continue.
Bitcoin Price Chart – Daily Price Chart
Source: IG
Bitcoin Long positions
- Entry Level 1: 28,409 – Buying into short-term weakness, which takes price back to the level of the 61.8% Fib retracement formed by the upward price move in BTC recorded between February 2019 and November 2021.
- Price Target 1: 30,000 – Round number price level.
- Price Target 2: 36,154 – 50% Fib level of the same price move.
- Stop Losses: < 28,170 – Region of 20 SMA on Daily Price Chart.
Ethereum
Ethereum Chart – Daily Price Chart
Source: IG
Ethereum Long positions
- Entry Level 1: 1,863 – Buying into any weakness, which takes price back to resistance/support level offered by the price high of 23rd March.
- Price Target 1: 2,000 – Psychologically important price level previously tested on 14th August 2022.
- Stop Losses: < 1,821 – Region of the 20 SMA on the Daily Price Chart.
Risk Statement: Trading financial products carries a high risk to your capital, especially trading leverage products such as CFDs. They may not be suitable for everyone. Please make sure that you fully understand the risks. You should consider whether you can afford to take the risk of losing your money.

Forextraders' Broker of the Month
BlackBull Markets is a reliable and well-respected trading platform that provides its customers with high-quality access to a wide range of asset groups. The broker is headquartered in New Zealand which explains why it has flown under the radar for a few years but it is a great broker that is now building a global following. The BlackBull Markets site is intuitive and easy to use, making it an ideal choice for beginners.