
FOCUS ON: Risk-on sentiment remains strong, but inflation reports are still the key data points to watch.
- Modest weekly gains leave technical indicators relating to risk-on assets in ‘Strong Buy’ territory.
- Employment, GDP, and sentiment reports due this week could throw up further trading opportunities.
- Signs that inflation is cooling and that central banks could pivot to more ‘dovish’ policies is driving prices.
Trading Ideas
We created this Weekly Tips section to share possible trade entry and exit points based on our technical analysis. We also have other methods to validate our trades which we can’t publicly share that help to increase their success. All our trades include entry and at least one target price. Stop losses are applied at the reader’s discretion. Our strategies typically trade with a wide stop loss, and risk is further mitigated by trading in small sizes.
Instrument | Price | Hourly | Daily |
GBP/USD | 1.2423 | Neutral | Strong Buy |
EUR/USD | 1.0993 | Strong Buy | Strong Buy |
USD/JPY | 133.22 | Strong Buy | Strong Buy |
S&P 500 | 4,146 | Strong Buy | Strong Buy |
NASDAQ 100 | 13,102 | Strong Buy | Strong Buy |
FTSE100 | 7,910 | Strong Buy | Strong Buy |
Gold | 2,011 | Strong Buy | Strong Buy |
Crude Oil WTI | 82.41 | Sell | Strong Buy |
Bitcoin | 29,873 | Sell | Buy |
Ethereum | 2,088 | Strong Buy | Strong Buy |
UTC: 09:30
US Dollar Basket Index (DXY)
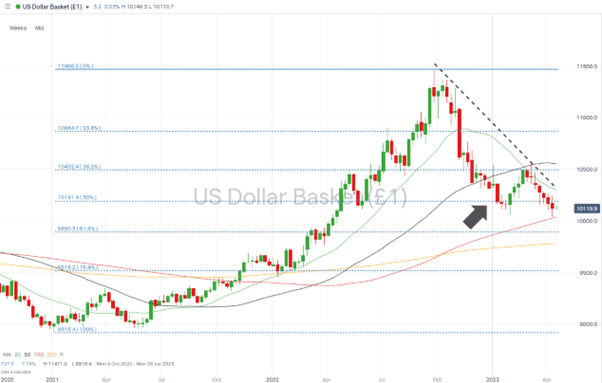
Weakness in the dollar resulted in the US Dollar Basket index printing prices in the region of 100.38 last week. It’s been 12 months since the index traded below the psychologically important 100.00. With price now below the key support level of 101.91 and with price action bearish, a test of 100.00 appears increasingly likely.
US Dollar Basket Chart – Weekly Price Chart – Below 50% Fibonacci Retracement
Source: IG
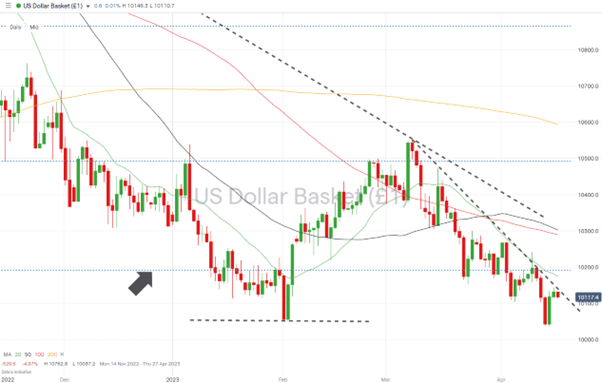
US Dollar Basket Chart – Daily Price Chart
Source: IG
Short positions
- Entry Level 1: 101.73 – Region of the 20 SMA on the Daily Price Chart. The DXY index has failed to close above this metric since 10th March.
- Price Target 1: 100.35 – Region of the 100 SMA on the Weekly Price Chart and close to year-to-date low of 100.37
- Price Target 2: 100.00 – Psychologically important price level.
- Stop Loss: > 102.89 – Region of the convergence of 50 and 100 SMA on the Daily Price Chart.
Long positions
- Entry Level 1: 100.37 – Region of support level formed by price lows of 1st and 2nd February and 13th and 14th April.
- Price Target 1: 101.36 – Resistance trendline of the downward price move started on 8th March.
- Price Target 2: 101.73 – In extension, the 20 SMA on the Daily Price Chart has guided the recent price fall, which started in mid-March.
- Stop Loss: < 100.00 – ‘Round number’ support level.
GBPUSD
The upcoming week is a busy one in terms of UK economic data releases. Unemployment numbers will be released on Tuesday, the CPI inflation report will hit the markets on Wednesday, and retail sales and PMI data will be updated on Friday. All those reports could potentially trigger price moves in sterling-based currency pairs, with the CPI report being the main one to watch. Any surprises regarding the inflation rate could start a pivot in interest rate policy by the Bank of England.
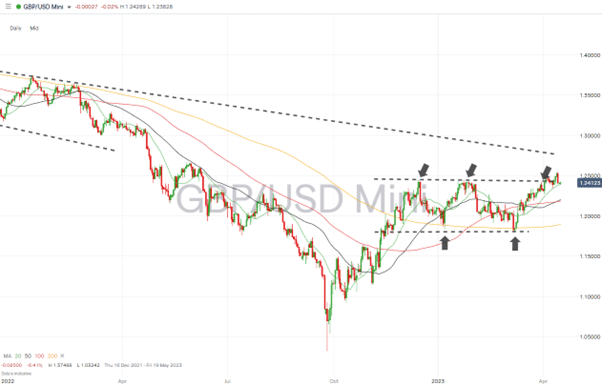
Daily Price Chart – GBPUSD Chart – Daily Price Chart
Source: IG
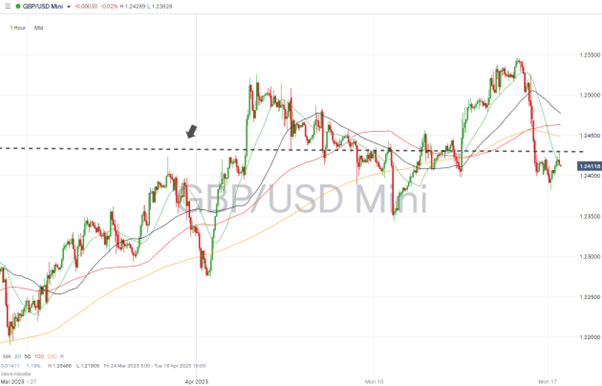
GBPUSD Chart – Hourly Price Chart
Source: IG
Short positions
- Entry Level 1: 1.24443 – Resistance level formed by price highs recorded in December 2022 and January and April 2023.
- Price Target 1: 1.22156 – Price level of the 61.8% Fibonacci retracement of the price fall between 14th December 2022 and 6th January 2023.
- Price Target 2: 1.21947 – Region of the 50 and 100 SMAs on the Daily Price Chart.
- Stop Loss: > 1.25466 – Resistance level formed by year-to-date price high of 14th April.
Long positions
- Entry Level 1: 1.25466 – Using a breakout strategy which captures further upwards momentum and pushes past the current year-to-date high. A higher-than-expected CPI number on Wednesday could trigger such a move by pointing towards UK interest rates remaining higher for longer.
- Price Target 1: 1.27485 – Resistance offered by a downward trendline dating back to May 2021.
- Price Target 2: 1.28849 – in extension, region of the 50 SMA on the Monthly Price Chart.
- Stop Loss: < 1.23455 – Swing-low price level recorded on 10th April. Tighter stop loss offered by 20 SMA on the Daily Price Chart, which is in the region of 1.23966.
EURUSD
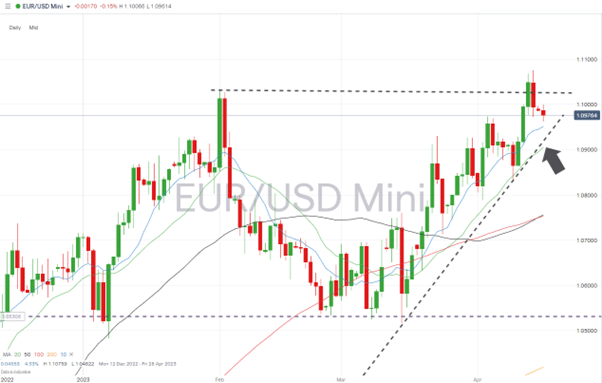
EURUSD continues to trade above the supporting trendline of the rally that started in mid-March. With the RSI on the Daily Price Chart at 59.6, the market is far from being ‘overbought’. That leaves room for further upward movement and a retest of the round number resistance level of 1.100 and the year-to-date high of 1.10759 recorded on 14th April.
EURUSD Chart – Daily Price Chart
Source: IG
EURUSD Chart – Hourly Price Chart
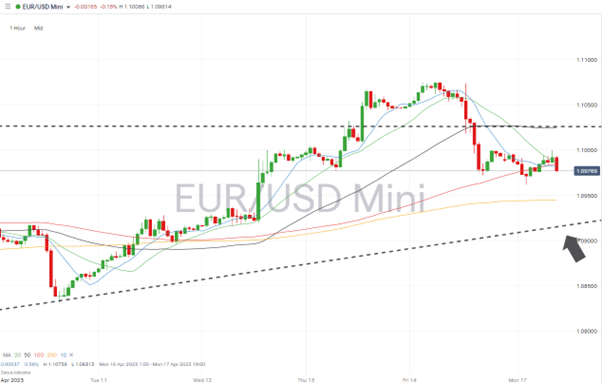
Source: IG
Short positions
- Entry Level 1: 1.1000 – Psychologically important price level has acted as resistance since Friday 14th April.
- Price Target 1: 1.09512 – Region of the 10 SMA on the Daily Price Chart.
- Price Target 2: 1.0920 – Supporting trendline of the rally in EURUSD that dates back to 15th March.
- Price Target 3: 1.06114 – In extension, the 38.2% Fibonacci retracement price level marked by the EURUSD price fall between January 2021 and September 2022.
- Stop Loss: > 1.10759 – Year-to-date price high printed on 14th April.
Long positions
- Entry Level 1: 1.0920 – Using the supporting trendline dating from 15th March as a chance to buy into short-term price weakness.
- Price Target 1: 1.1000 – ‘Round number’ resistance offered by the 1.1000 price bar.
- Price Target 2: 1.10759 – Year-to-date price high printed on 14th April.
- Stop Loss: < 1.09054 – Region of the 20 SMA on the Daily Price Chart.
Indices
S&P 500
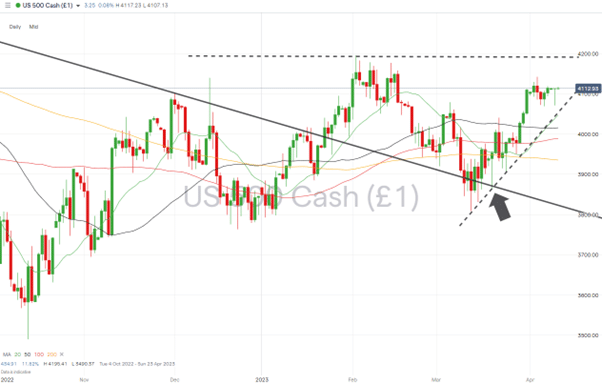
A weeklong period of price consolidation has not moved the S&P 500 index below the steep supporting trendline of the rally that started on 13th March. While that key metric holds, the path of least resistance continues to appear to be upward. The 4189-price level could offer resistance as it marks where the index will have gained +20% in value from the price-low of October 2022 and formed a new bull market.
S&P 500 Chart – Daily Price Chart – Trendline Support
Source: IG
S&P 500 – Hourly Price Chart – Trendline Support
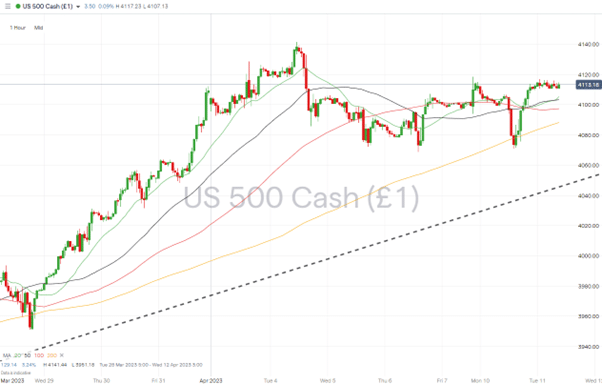
Source: IG
Short positions
- Entry Level 1: 4,141 – The S&P 500 has traded sideways over the last week. Booking short positions in the region of the price high of Tuesday 4th April could take advantage of the market appearing to have run out of steam.
- Price Target 1: 4,061 – Region of the supporting trendline of the bull-run formed since 13th March.
- Price Target 2: 4,015 – Region of the 50 SMA on Daily Price Chart.
- Stop Loss: > 4,175 – Price high of 14th February 2023.
Long positions
- Entry Level 1: 4,108 – With the RSI on the Daily Price Chart at 63.3, there is room for additional buyers to come into the market before it reaches 70 and becomes overbought. Price weakness which takes price into the region of the multi-week supporting trendline and the 20 SMA (4,088), could offer an opportunity for those looking to catch the upwards momentum in US stocks.
- Price Target 1: 4,112 – Year-to-date price high of 31st March 2023.
- Price Target 2: 4,175 – Region of 20 SMA on Monthly Price Chart.
- Stop Loss: < 4,088 – Region of the 20 SMA on the Daily Price Chart.
Crypto – Bitcoin & Ethereum
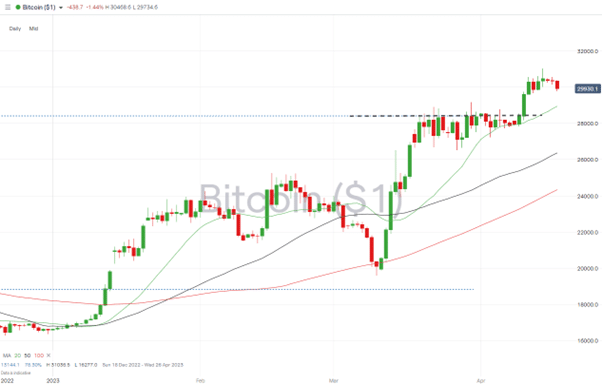
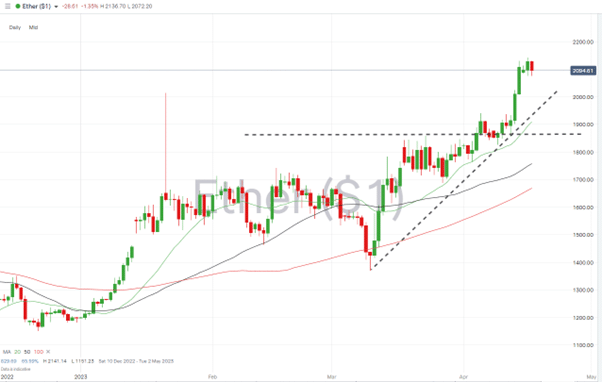
Ethereum’s upgrade last week was successful, and lifting the mood of the entire crypto market was particularly beneficial for the price of ETH. Up 8.81% on a week-on-week basis, Ethereum is now positioned to test the March 2023 highs. Bitcoin has lagged behind the price performance of its smaller rival. Still, consolidation in the region of the psychologically important $30,000 price level does not rule out further upward moves soon.
Bitcoin Price Chart – Daily Price Chart
Source: IG
Bitcoin Long positions
- Entry Level 1: 28,409 – Patient BTC investors may wait for weakness which takes price back to the level of the 61.8% Fib retracement formed by the upward price move in BTC recorded between February 2019 and November 2021. The 20 SMA on the Daily Price Chart (28,952) is an alternative entry point.
- Price Target 1: 30,000 – Round number price level.
- Price Target 2: 36,154 – 50% Fib level of the 2019 – 2021 price move.
- Stop Losses: < 26,525 – Swing-low of 27th March 2023.
Ethereum
Ethereum Chart – Daily Price Chart
Source: IG
Ethereum Long positions
- Entry Level 1: 2,000 – Buying into any weakness, which takes price back to the round number resistance/support level of $2k, also in the region of the supporting trendline dating from 10th March.
- Price Target 1: 2,141 – Price high of 16th April 2023.
- Price Target 2: 2,397 – 38.2% Fibonacci retracement level of the November 2021 to June 2022 price crash.
- Stop Losses: < 1,909 – Region of the 20 SMA on the Daily Price Chart.
Risk Statement: Trading financial products carries a high risk to your capital, especially trading leverage products such as CFDs. They may not be suitable for everyone. Please make sure that you fully understand the risks. You should consider whether you can afford to take the risk of losing your money.

Forextraders' Broker of the Month
BlackBull Markets is a reliable and well-respected trading platform that provides its customers with high-quality access to a wide range of asset groups. The broker is headquartered in New Zealand which explains why it has flown under the radar for a few years but it is a great broker that is now building a global following. The BlackBull Markets site is intuitive and easy to use, making it an ideal choice for beginners.