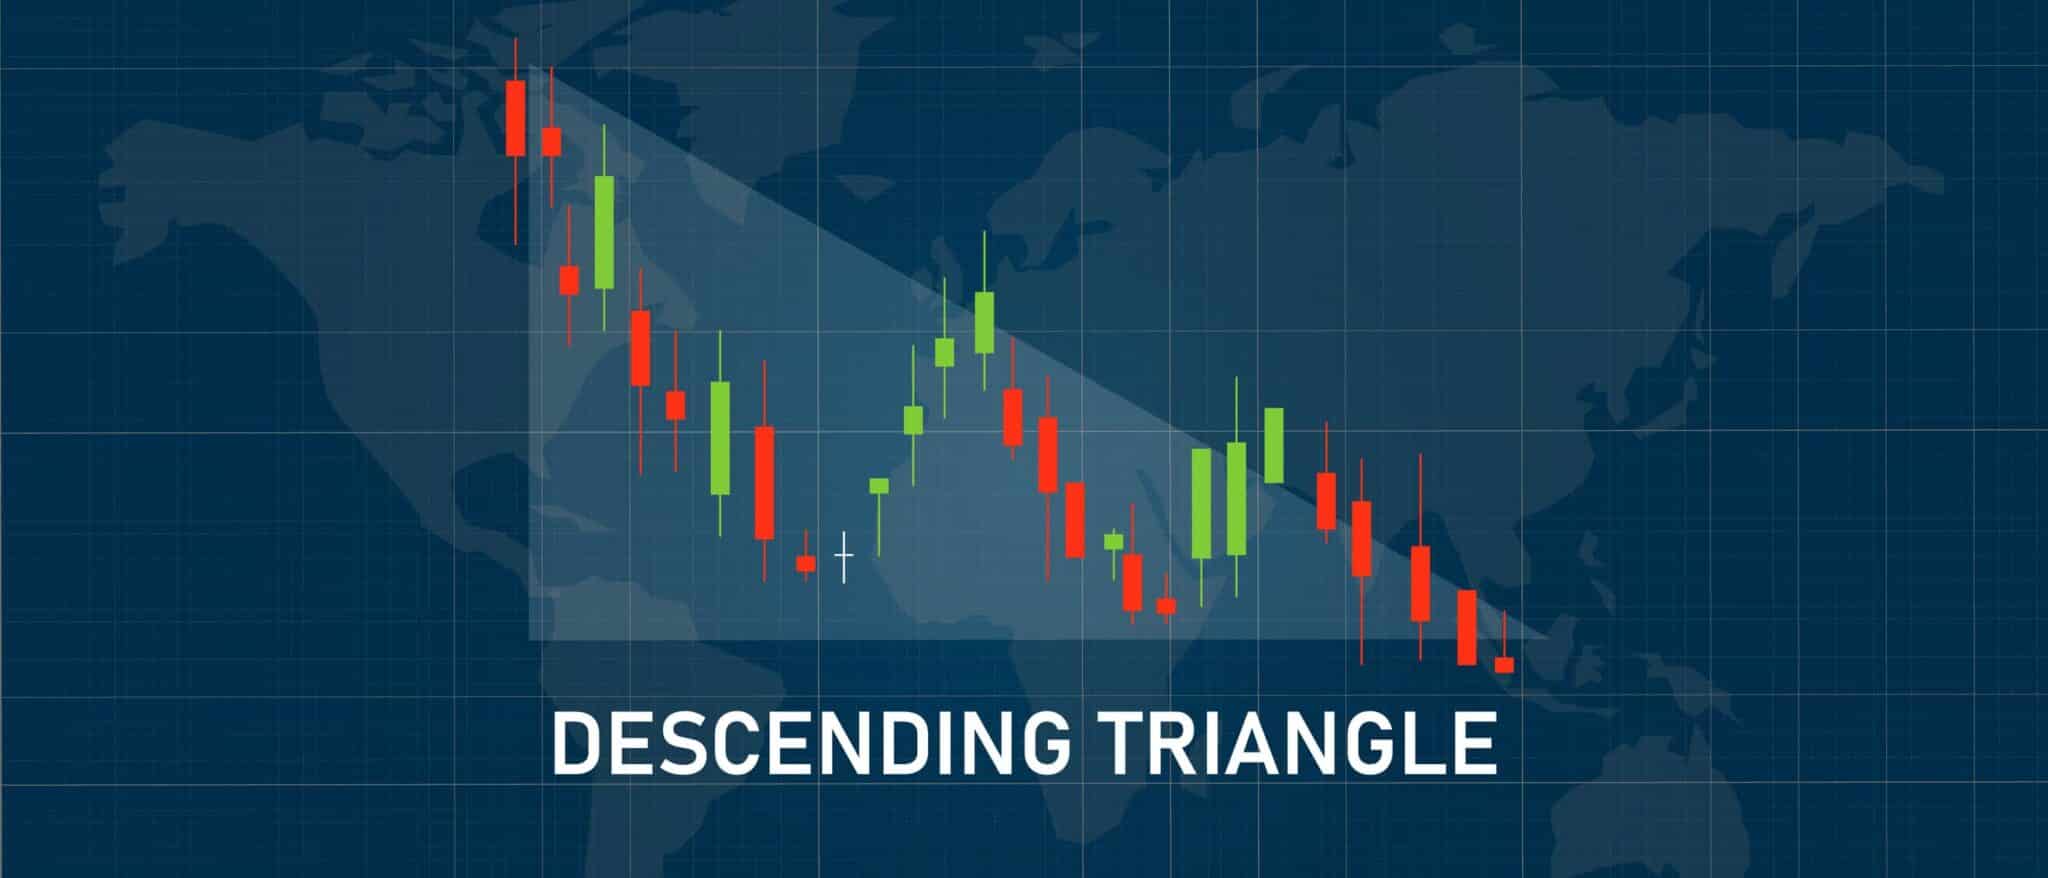
The descending triangle pattern is a popular chart formation used in technical analysis, and when it appears on a chart, it signals a potential bearish breakdown in price. This is a common pattern that is relatively easy to identify because of its triangular shape, and it forms in all markets and timeframes.
Studying chart patterns is an important part of technical analysis that traders use to forecast probable price direction by simply knowing the type of pattern they are dealing with.
In this article, we will explain in detail what the descending pattern looks like, how to use certain drawing techniques to better expose the shape of the formation, and how traders typically trade this pattern.
The Descending Triangle Pattern Explained
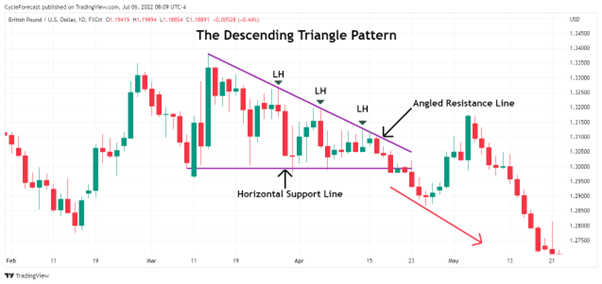
Image for illustration purposes only
The chart example above shows a descending triangle with an upper angled resistance line and a lower horizontal support line. Technical analysts will use these two trendlines to better visualise the pattern. The angled resistance line was drawn by simply connecting the lower highs (labelled LH) of the candlesticks as price contracted into a narrower range.
The lower support line was drawn by connecting the lows of the candlesticks, creating a horizontal line. The descending triangle pattern, therefore, forms when price continues to find support at a horizontal level, while the upper part of the triangle continues to make lower lows as the trading range gets smaller.
Related Articles
How to Trade the Descending Triangle Pattern
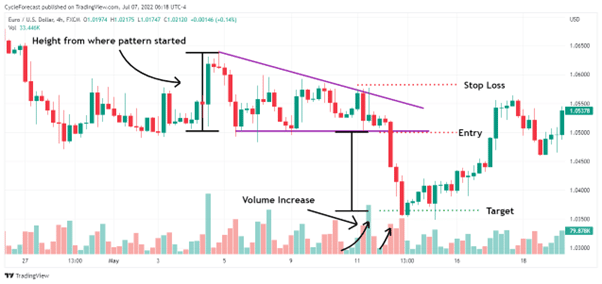
Image for illustration purposes only
Following the chart example above, we will now look at how traders typically trade the descending triangle pattern.
Note that a volume indicator was added on the lower panel of the chart – we will explain why shortly. Traders who follow technical patterns will in most cases include indicators to assist them with their trading decisions.
As the descending triangle forecasts a potential bearish breakout, traders will look for an opportunity to sell once price breaks below the horizontal support line. Once a breakout does occur, a short entry can be taken with a stop loss above the final lower high before the breakout occurred.
To set a target, traders will often measure the height from where the descending triangle pattern started from and project it lower from the entry level by the same distance (see black vertical lines).
What makes the volume indicator so useful, when used in conjunction with the pattern, is that volume started increasing right before and after the breakout occurred. An increase in volume confirmed that more and more sellers were entering the market and that a breakout was imminent.
There will, however, be times when a candlestick initially breaks below the lower horizontal support line but closes above it again, even though the upper resistance line is sloping downwards and the range within the descending triangle pattern is getting narrower.
When this happens, a trader can often be fooled into entering a short position too soon. So, how would you know that you are dealing with a high-probability breakout or a possible fake breakout? The additional breakout confirmation method below seeks to address this problem.
Additional Breakout Confirmation Method
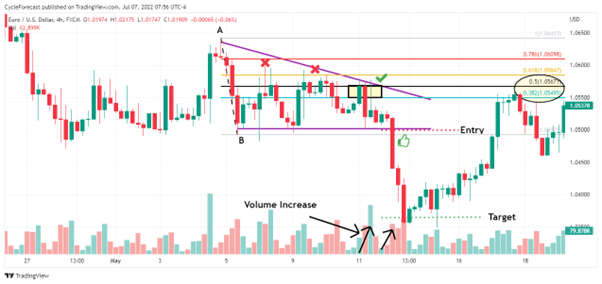
Image for illustration purposes only
Continuing with the same entry setup as before, here is a simple method that will in most cases help you with identifying a narrower range (apart from the angled resistance line) and prevent you from entering during a fake breakout.
Simply draw your Fibonacci retracement levels from the high at point A to the low at point B. During the initial phases of a descending triangle, price will generally retrace towards the 61.8% or 78.6% Fib retracement levels, form a lower high and then move lower again.
Note how this happened twice when price created two lower highs at the two red crosses on the chart (red Xs). On the third retracement, however, price only managed to move between the 38.2% and 50% Fib retracement levels (green check mark) and immediately reversed lower, with that additional confirmation from the volume indicator.
This simple method will generally force you to remain patient until you see a lower high form at either the 38.2% or 50% Fib retracement levels. If price starts moving lower again from these levels with an increase in volume, you would know that you have a high-probability breakout setting up.
Next, we will look at more trading examples that show the same conditions prior to high-probability setups.
Descending Triangle Trading Examples
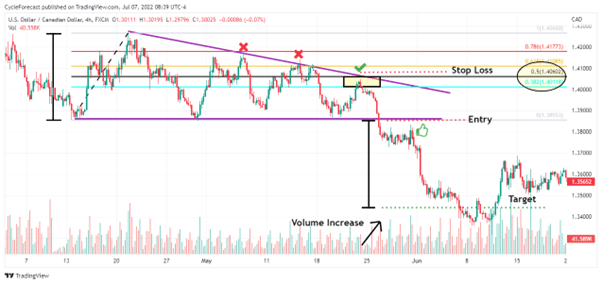
Image for illustration purposes only
Our first trade example shows a descending triangle pattern that was clearly visible on the four-hour timeframe. All the conditions that we discussed before showed up during the formation of the pattern and preceded a strong breakout.
Let’s recap those conditions again:
- Both the upper and lower trendlines clearly showed the classic descending triangle shape.
- During the initial phases of the formation, lower highs formed at important Fib retracement levels – first at the 78.6% and then the 61.8% Fib levels (two red Xs).
- The final lower high, prior to the breakout, formed between the 38.2% and 50% Fib retracement levels – signalling that the pattern might be nearing an end (green check mark).
- As soon as price started moving lower again, volume started increasing.
The presence of all these conditions were early confirmation ‘signs’ that a high-probability breakout was about to happen, and after price broke below the lower horizontal support line, a strong decline followed that reached the target level in quick succession.
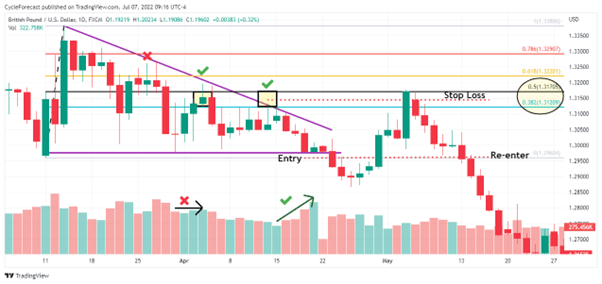
Image for illustration purposes only
Our final trade example shows a trade setup on the same market we presented at the beginning of this article. With this setup, price broke out of the lower horizontal support line after all the right conditions were present, but shortly after an entry was taken, price moved higher and the short position was stopped out.
Although the descending triangle pattern forecasts a bearish breakout, there will be times when your position gets stopped out without price reaching your target. No price pattern leads to a 100% success rate – taking a loss here and there is part of the business of trading.
With that being said, it was possible to re-enter again soon after the first short position was stopped out (see image below).
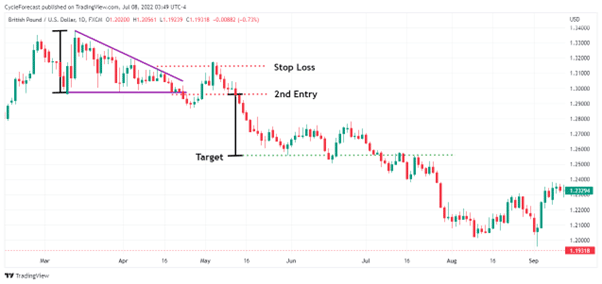
Image for illustration purposes only
The resulting decline after the second short entry moved fast, as one would expect after a descending triangle pattern ends. Entering a position, a second time around after a loss, might be too risky for some, but in the end this example serves to show that the pattern forecasted a decline in price, which eventually happened.
Conclusion
The descending triangle pattern, like so many other technical patterns, forecasts a specific direction that price might move towards when the pattern ends – in this case, a bearish breakout that often leads to a strong decline.
All traders seek to find some sort of edge in the markets, and by studying and trading technical patterns, the edge they get is in knowing what price will likely do after a pattern ends and then using this knowledge to their advantage.
In this article, we explored what a descending triangle looks like, how to draw the trendlines to better visualise the pattern, how to trade the pattern with the help of volume, and introduced an additional confirmation method to avoid possible fake breakouts.
Having the patience to wait for all the right conditions to appear before you enter a trade will greatly help you in finding the highest-probability descending triangle pattern setups.

Forextraders' Broker of the Month
BlackBull Markets is a reliable and well-respected trading platform that provides its customers with high-quality access to a wide range of asset groups. The broker is headquartered in New Zealand which explains why it has flown under the radar for a few years but it is a great broker that is now building a global following. The BlackBull Markets site is intuitive and easy to use, making it an ideal choice for beginners.