The first quarter of 2018 is now in the history books. Besides a new monthly Non-Farm Payroll Report, analysts will be focusing on the new earnings season and how various scenarios might play out, based on which sectors over or under perform. There will be a slight lull before this action starts, and what better way to spend your free moments than to go searching for the Holy Grail, the magic chart that will surely tell us all exactly what might transpire over the next ninety days. Fame and fortune awaits the analyst that can pull off this feat, but, based on previous attempts, the odds are slim.

For those that spurn the notion that a treasure-laden chart is even out there to be found, their thoughts drift out to a more distant future and which recent actions might have a major ripple effect going forward. There is one word that comes to mind for this specific exercise – China. Yes, the Middle Kingdom is the giant gorilla in the room when it comes to any long-term outlook of what might come to be. Futurists and economists alike are trying to zero in on what might be the next wave of innovation. Will it be AI or Robotics or some technological sector that is currently off the radar screen. Whatever it is, you can be assured that China will be in the forefront of it all.
Some pundits have even suggested that recent trade tariff proposals are designed to slow down the gargantuan Chinese economic machine so that Western technologists can play catch up. For all intents and purposes, one could ask has the battle already been lost? Asian cultures tend to be more long term in their focus, whereas North America and Europe are often driven by short-term considerations, i.e., immediate returns on invested capital. If the future is truly up for grabs, then perhaps an analyst or two has already done some research and has been willing to share his insights with colleagues. We will summarize what is out in the press at the moment.
Reade more forex trading news
What is the latest and greatest “Magic Chart” out there?
When you read a headline like, “Bank Loan Data Suggests The Top Is In”, curiosity takes over, and you have to take a peek. The analytical path chosen by this author was to concentrate on Bank Loan Growth. He starts simple enough: “Bank loan growth is a lagging indicator of economic activity. While a lagging indicator, bank loan growth is highly sensitive to economic activity, making it a great segment to watch to confirm forecasts made from leading and coincident indicators.”
The author was also quick to defuse the “teaser” in his title. According to him, the “Top” was not a market top. Equities tend to behave in a world of their own, deviating as they like from the underlying economy. The phrase “Top” in this author’s context has more to do with economic growth, which, once it begins to decline, it moves inexorably down the road until recession takes over. In order to evade future attempts at accountability, if these forecasts should prove futile, he also reiterates that past behavior is no guarantee of what may transpire in the days ahead.
The first chart in this presentation has to do with basic Bank Loan Growth:
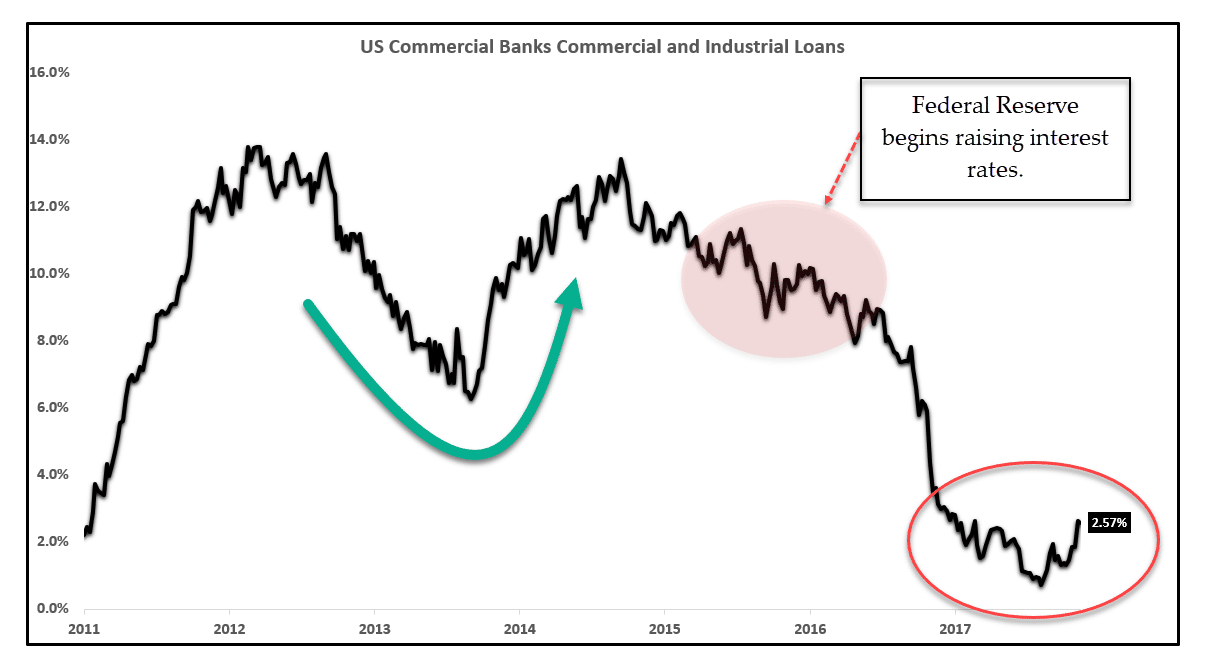
It looks like we have a Double-Top formation, but the desire is to tie the behavior to repeating business cycles. The data points are too jagged to suggest a smooth correlation. The “Red shaded” oval coincides with the Fed’s decision to normalize interest rates. Those actions have had the intended effect, if you will. Economic growth has slowed, if only gradually. In order to gain a better perception of what is going on behind the data, it is often good practice to “smooth out” any jagged-ness by switching to some type of averaging over a consistent time period.
The author chose to present “Bank Loan Growth – 5-Year Annualized Pace”:
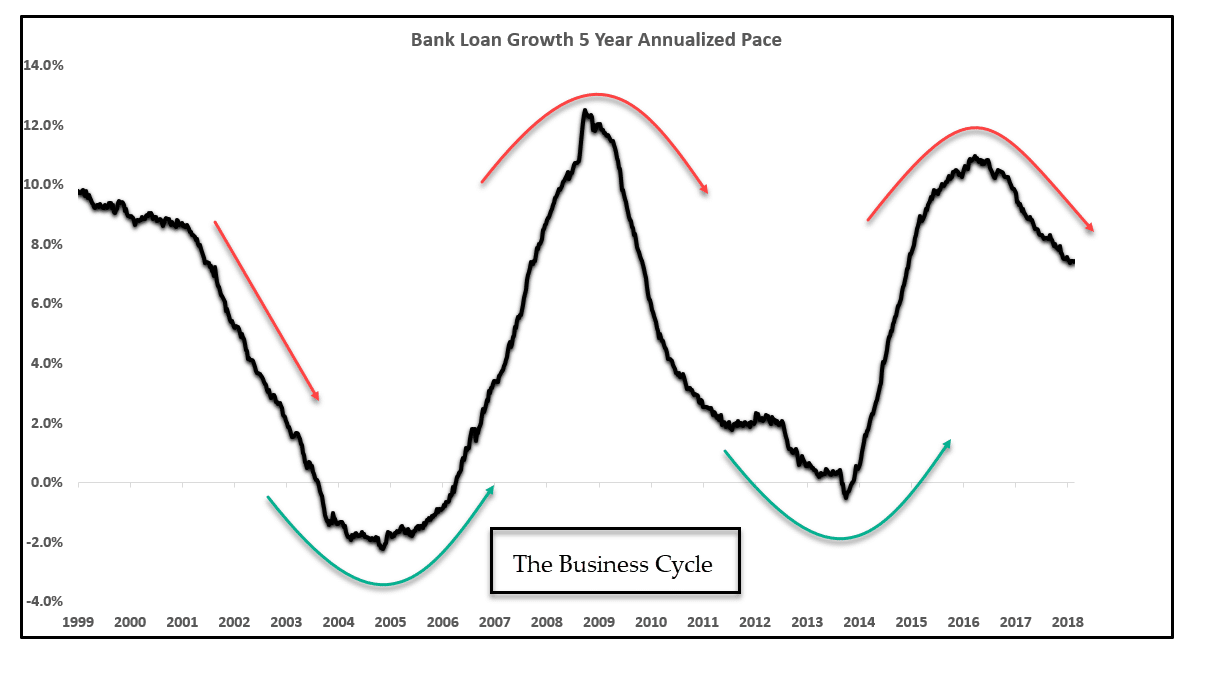
Voila! A very well defined Business Cycle suddenly emerges. The most recent “Top” has obviously come and gone. We are presently on the descent, a possible reason that most stocks have corrected and not necessarily due to fears that trade wars are about to erupt. The author’s comment at this point re-states the obvious: “Lagging indicators, of course, are not used to make forecasts but rather to validate and confirm an earlier hypothesis. The chart above shows a peak growth rate in 2015-2017 and a clear and defined rollover in growth, similar to the past two economic cycles.”
When President Trump declared his tariff policy changes for China last week, “Trade Wars” became the most overly used phrase on every financial news outlet across the planet. After levying $60 billion worth of import tariffs upon steel from China, everyone was suddenly pontificating where China would direct their retaliatory response. To date, a meager $3 billion in import duties will be added to pork and other goods from U.S. exporters. It seems that the old maxim has held true – The country with the largest surpluses has the most to lose in a trade war. China has done the math and realizes that it has too much to lose.
The Business Cycle chart is very convincing, demonstrating an economic top has formed and that we are on the descent, but a single chart, to be trustworthy, needs confirmation from another source. As a matter of fact, the money supply should also be contracting in a predictable fashion, all things being equal. When the Fed raises rates, the M2 Money Stock measure is supposed to decline, and so it does in the following chart:
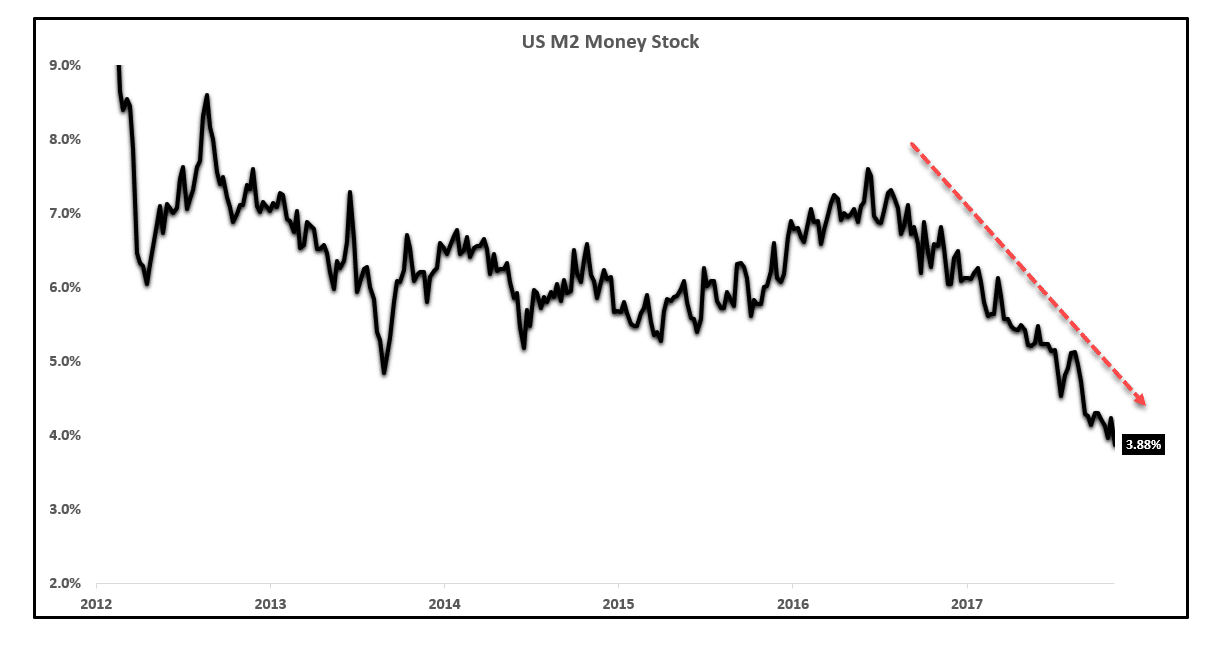
Another point to make is that the 3.88% figure shown above was actually below the published GDP growth for last quarter of 4.4%. The Fed governors are well aware of what these data points imply. If you extend this logic into 2018, as the Atlanta Federal Reserve has done, expectations are for a 1.8% GDP growth for the first quarter. How many investors have seen this surprise coming? The ones that have been selling, for sure. In conclusion, the author of this piece adds: “The forecast is for continued equity market volatility, more economic data weakness, yield curve compression, and lower interest rates.” Hold onto your hat, Martha – The winds of change are about to blow!
As for the long-term version, what dominates that discussion today?
When it comes to long-term forecasts, futurists tend to think in waves of innovation – What will be the primary driver of economic growth in the decades to come. According to one expert: “Innovation is a serious matter. It is the key to American prosperity, security, better jobs, and better health, as well as responses to coming challenges like energy security and global warming. But it’s not as simple as the president’s State of the Union address, or his Strategy for American Innovation would suggest, according to a recent study of economic history.”
If you peruse the articles in this genre, you discover “generational cycles of invention, expansion, and depression, which are called “Kondratiev waves” in honor of Nikolai Kondratiev, the Russian economist who first postulated their existence.” The beginning of this wave concept is commonly set as the first industrial revolution, with four waves that follow. Within this context, we are decidedly in the early formation of the “Sixth Wave”, as depicted in the diagram below:
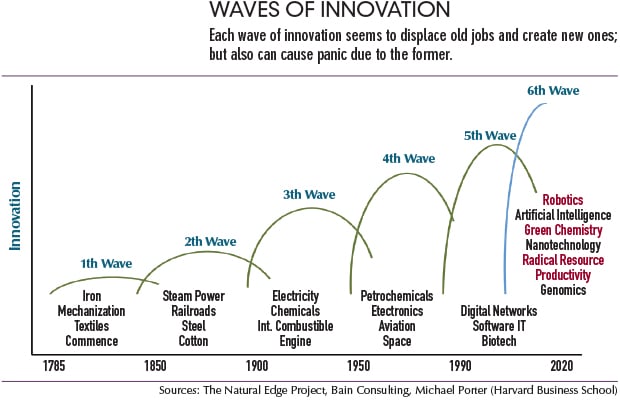
Have we truly reached a peak and moved past innovation from the 5th Wave? The answer is “Yes” for the following reasons: “Computers are rapidly approaching the point of saturation in many markets. Microprocessors are in every imaginable device, and there are over 4.6 billion cell phone users on the planet. Computer processor and memory manufacturing is a cut-throat business conducted on the slimmest of margins, and while technology keeps improving, at this point, much so-called “innovation” has become about advertising and sales, not fundamental technological breakthroughs.”
The experts in this field believe the jury is still out as to what the predominant “carrier branch technology” will be to start the next Kondratiev wave and the economic prosperity that will follow in its wake. Suffice it to say that government policy makers must be firmly behind encouraging investments in science and technology, not bickering over legacy systems and what constitutes real science. Scientific intellectual capital goes to where it is supported, which has been the case over the past few decades. Asia has been the greatest benefactor of this intellectual redistribution, so to speak.
Does China already have a leg up on the competition? Although some view the following opinion as a bit over the top, Peter Navarro of Bloomberg has written, “China in my view brazenly has released this China 2025 plan that basically told the rest of the world, ‘We’re going to dominate every single emerging industry of the future, and therefore your economies aren’t going to have a future.”’ That statement may sound scary, but every developed country on the planet also has loftily stated goals of dominance in various industries where it has a material market share.
The issue going forward, however, will be support and investment, not vilification over issues such as Climate Change and evolution. The United State has made great strides in the energy sector, but it seems as if, for every two steps forward, there follows one more step in the backward direction. Futurists are not politicians, but they are perturbed by political obstructionism: “Apparently these plans create anxiety in the White House, which we think in and by itself is a good thing. We’re much less sure about the suggested reaction though.”
Concluding Remarks
We are at the beginning of a new quarter. All bets are off. Time to count ballots, publish data, and react to winds of change. It is also a nice time to step back, take a deep breath, and ponder a bit more on what the future might bring, whether in the short term, as in next quarter, or the long term, as in the next decade or two.
From a short-term perspective, we have peaked from an economic standpoint. Slower growth is the profound reality, a result of increasing interest rates and a contracting money supply. Analysts could say that this simple forecast has already been baked into equity values, but we suspect more volatility and market corrections will be the name of the game. For the long-term, it is still up for grabs, but investment in science and technology will be key.
Having said all of this, we may now focus upon the earnings season!
 Your capital is at risk
  Your capital is at risk