

What is a lagging indicator? Lagging indicators (alternatively referred to as LIs) are flashing signals that formulate on past data while the variable under focus is current – hence the term ‘lagging’. When you boil it down, the primary ingredient of every LI – however it shows itself (i.e., as a metric, value, ratio, or point on a graph) – depends totally on measuring a past activity. In addition, LIs are easily measurable but unchangeable once they appear. Nonetheless, LIs frequently signal a possible trend continuation or disruption on their own (but mostly with other LIs).
Another way of looking at the lagging indicator is understanding its opposite – the leading indicator. The latter is significantly more challenging to measure because it relies on creative inputs designed to be predictive and, therefore, is substantially more flexible and abstract. We’ll show that, ironically, LIs often transition into leading indicators when analysts use them to predict future events.
Finally, it’s vital to appreciate that LIs impact a vast field, embracing the economic, business and investment/trading arenas. Consequently, we’ll focus on each separately.
Background and Context
1. Economy-centric LIs
Before we dig deeper into LIs, it’s perhaps advantageous to show some examples:
- A prime one is the US consumer price index (CPI) inflating in late 2022 by 7.7% (versus the same month the previous year) after previous readings that were progressively increasing each month.
- Such a severe CPI increase hasn’t occurred since 1982, and we can safely conclude that we’re in an inflationary trend.
- America is not alone. Australia, the UK, and all the euro nations are in the same boat, rowing with a different oar.
- Of course, sub-price indexes on gas, food and building materials contributed to the CPI inflation rate 30 days after they entered the economy.
Once CPI metrics hit the headlines, there is nothing one can do about it except draw on the knowledge to build strategies to bring prices down in future readings. The Fed, faced with rising CPI readings, is quick to wield its only (but effective) weapon – raising the discount rate (DC) by Y% with a prediction that the action will quell spending by X% – thus, reversing the price trend down the line. Arriving at Y and X are genuinely guesstimates, making DC manipulation the perfect example of a leading indicator – abstract and difficult to measure precisely.
Another example – think about this: economists tend to analyse two LIs in combination. One of the most vital LI combinations is CPI and US gross domestic product (GDP), where the latter continues to show a healthy 2.6% year-on-year (looking back a year in September 2022). Considering that high inflation is firmly in the mix, the combination possibilities are 7% (plus) CPI with:
- Strong GDP growth = An inflationary economy
- Zero GDP growth or GDP retraction = Recession + Inflation = Stagflation
Everyone sits with bated breath to see quarterly metrics of this LI pairing, fearing recessionary ramifications (generally unemployment) and erosion of our buying power simultaneously – a severe economic hardship for many people.
The example above reveals how LIs viewed in unison can accurately tell a country’s economic temperature. Analysts frequently draw upon other LIs such as balance of payments (BOP), the unemployment rate, and labour cost per unit of output to confirm that the observed trends are gaining traction.
2. Business-centric LIs
Small and medium-sized businesses (SMBs) and enterprises rely on LIs to measure the effectiveness of their marketing, production and HR strategies. In most instances, they’re looking at financial statements and reports that are a day, a week, a month, or a year in arrears, indicating that vital KPIs (key performance indicators) are a vivid signal of the entity’s operational health.
Indeed, KPIs rule the roost in most boardrooms because they are easily measurable and connect to pinpointed outcomes. According to a reliable source, the marketing and sales departments cover the lion’s share of KPIs streaming through the system (70.5%), followed by finance (11.4%). From professional overviews:
- The marketing KPIs helping businesses penetrate markets include tracking customer leads, customer lifetime value (CLV), customer acquisition costs (CAC), social media reach, website traffic, newsletter subscribers, and more.
- In sales, monthly recurring revenue (MRR) is a vital LI, as is client acquisition rate (CAR), new paid customers, repeat purchase rate, and average order price.
- Financial KPIs include EBITDA, ROI, and asset turnover (revenue/assets).
KPI programs reviewed in combination are insightful clues to where corporate teams are excelling or dropping behind their competitors. The less the ‘lag’, the better the accuracy of current situations. The difference between exceptional companies and the ‘herd’ in the industry is how management interprets the LIs (KPIs) and how they improve matters. For example, a significant increase in CAR in conjunction with aligned deterioration of CLV and CAC is evidence that marketing initiatives are veering off track. Thus, it often means that executives must admit that their proposals are turning out to be losers. Of course, change is a must, but emotional obstructions (such as ego) invariably obstruct progress or slow it down. Thus, KPIs function best with objective and unemotional reactions to test out new things.
3. Trading-centric LIs
Indeed, charting and technical analysis are aligned to merge into a mainstream methodology that specific currency, commodity and securities traders depend on to identify trends, entry and exit points in their focused investment preferences. One of the tactics in this approach is to take notice of proven LIs, which fit neatly into graphic representations, the foundation stone of chartist thinking.
An LI in charting is a graphic display of a signal moving behind the price, demonstrating delayed feedback to the trader. So, as an example, the LI termed simple moving average (SMA) may be above, equal to, or below the current price. Either way, a price increase intimates that we’ll see SMA rising on the following reading and vice versa with a price drop. Although this seems obvious and oversimplified, LIs used in combination can be massively influential in identifying price action within a pattern, which, in turn, may create insight into where the price may go next. Therefore, LIs have gained considerable respect in professional investment circles as trading tools.
Related Articles
- EMA Indicator Explained – What is an Exponential Moving Average?
- Bollinger Bands Strategy – How to Use the Bands in Forex Trading
- Forex Indicators: Is There a Holy Grail Out There?
Crucial insights into trading LIs citing two examples:
Traders deploy multiple LIs in their trading strategies. The list includes the following:
- Bollinger Bands
- Relative strength index (RSI)
- Moving averages (simple and exponential)
- Simple moving average (SMA)
- Keltner Channel
- Moving average convergence divergence (MACD)
- Parabolic SAR
- Average true range (ATR)
- Pivot points
We’ve chosen two of the most popular to show how they work, as follows:
- SMA: Although it’s a famous LI, the SMA can double up as a leading indicator. How can that be?
- As an LI – a reflection of the average price over time – it relates to the current price.
- As a leading indicator, traders use it to project where the price may find support or resistance.
- Historical evaluation of the SMA categorises it as containing a type of magnetism that we call mean reversion (MR), where price spiking up from the SMA or dipping below it frequently returns to it over time.
- Naturally, the challenge is to calculate what ‘time forward’ means and where one estimates the SMA will be when MR kicks in.
- Bollinger Bands: Bollinger Bands are expansions on the SMA, with the latter as its centre path and featuring outer bands on either side to mark the degree of deviation that a price can move away from the SMA. Thus, it defines a range of resistance (above the SMA) or support (below it). That’s if the price oscillates up and down but fails to stay sustainably on the SMA path for any length of time. Indeed, they serve traders as a kind of envelope, prescribing upper and lower deviation borders expected of pricing around the SMA. They’re there to set expectations so that price veering off course is not cause for alarm or a problem, as long as they stay within the envelope’s parameters.
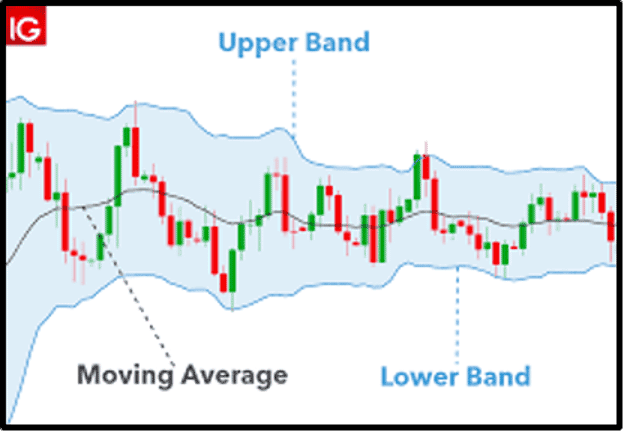
So, traders using BBs can see relative value versus the SMA. As a result, the price touching the upper or lower band may indicate a reverse movement shortly, responding to the SMA’s pulling power.
The crucial thing to remember is that chartists look at numerous LIs to confirm or reject readings on others. The more LIs that one looks at simultaneously in a trading situation where they don’t contradict one another (i.e., they align), the more that traders can trust the readings. As a result, confidence levels in using BBs or SMAs to predict the future increase significantly.
Conclusion
LIs are crucial signals in dynamic environments where metrics count and are easy to measure. Hundreds of them drive economies, businesses and trading activities, recording data and generating multiple averages, means, and other configurations to give more meaning to current variables. The common chord is that LIs depend on information build-up behind the metric that analysts want to project or know more about. Finally, laggards frequently convert into leaders as long as they earn the trust of the economists, CEOs and traders who work with them routinely.

Forextraders' Broker of the Month
BlackBull Markets is a reliable and well-respected trading platform that provides its customers with high-quality access to a wide range of asset groups. The broker is headquartered in New Zealand which explains why it has flown under the radar for a few years but it is a great broker that is now building a global following. The BlackBull Markets site is intuitive and easy to use, making it an ideal choice for beginners.