
Trading foreign currencies is a complex art form, requiring patience and the talent to ferret out profitable trading opportunities. The latter process need not be complicated, but most beginners tend to have more than half a dozen indicators at play on a single screen, a level of clutter that adds more complexity to the task than is necessary.
There is also a tendency, even among veteran traders, that there exists a “Holy Grail” of indicators, one that would create wealth beyond all measure if only the trader or analyst could find it or tinker with an existing formatted system. The issue, however, is that Technical Analysis (TA) is based on the manipulation of previous pricing data points. As history has revealed, the past is no guarantee of future performance.
The answer to this problem has always been to start with a clean screen, go back to the basics, and gradually build an effective trading strategy that is, in a word, uncluttered. The most basic indicator is a Simple Moving Average (SMA). The curve will smooth out the bumps in candlesticks and provide visual clues about what is transpiring in the market for your chosen financial asset. If the curve is flat, the market is ranging. If the curve has a slope, a trend is in play.
Studies have shown that markets tend to range 70% of the time, but successful trading depends upon making the trend your friend and riding it for all it is worth. Traders sometimes forget that the trend may be your friend, but it is time to close your position when it bends at the end. An SMA can help with opening and closing positions, but this indicator lags the market and can be insensitive to sudden bursts of volatility.
It is a fact that sudden bursts of volatility precede a directional change in pricing behaviour. For this reason, analysts modified the SMA and developed what is known as an Exponential Moving Average or “EMA”. The EMA counters the lagging weakness of the SMA indicator to a degree by weighting more recent prices more heavily. Its origins are unknown, but its use was designed to smooth out the effects of price volatility and create a clearer picture of changing price trends. Traders use an EMA, sometimes in concert with another EMA for a different period, to signal confirmation of a change in price behaviour.
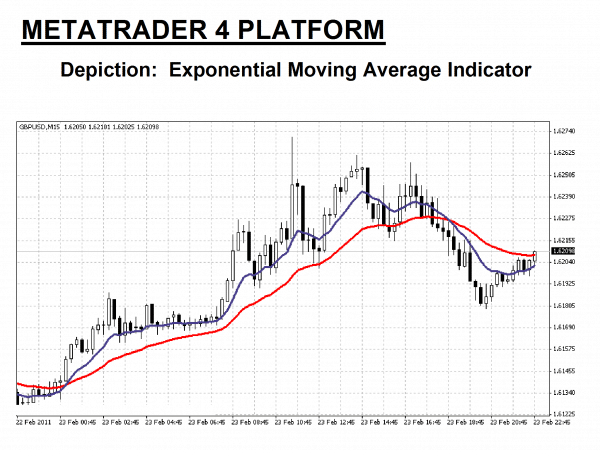
Two EMA lines are depicted in the graphic presented above, where the “Purple” line has a short period of “13”, and the “Red” line follows a 28-period regimen. The primary focal points occur when the two lines cross, as indicated by the “Green” circles. The quicker of the two lines, the Purple one, is the signal generator, and as long as the space between the two lines remains open, the trader is encouraged to ride the trend for gain. Traders will also key on moments when candlesticks cross a slower line, signifying that a trend is losing steam.
How does a trader decide on a period combination for two opposing EMA lines? There is no set formula. In this 15-minute chart of the GBP/USD currency pair, reasonably short periods were chosen, but testing in a demo practice environment is the best way to find a combination that appeals to the trader’s tastes. Historically, 25, 50, 100, and even 200 periods have been used for moving averages to denote significant crossovers in pricing models for longer terms.
The EMA indicator uses “period” and “price”, as does the SMA, but fresher prices are given more weight to make the indicator respond more quickly to market changes. Since it reacts more quickly, it can generate more false signals. The EMA works well in tandem with another EMA in strong trending markets, but the use of an EMA in a sideways market is not recommended. Since the EMA is so popular, it can often form a support or resistance line where investors anticipate taking their profits or re-entering the market.
While simple is good, the use of two additional indicators will often address the lagging and volatility concerns that exist with a pair of EMA lines. The most popular additions are a momentum oscillator for the lagging issue and a volatility-based indicator like the Average True Range “ATR”. No indicator is perfect, i.e., a Holy Grail does not exist. False-positive signals will occur, but practice time on a demo system will bring confidence to your use of these TA tools.
How is the EMA Indicator calculated?
The first step toward understanding how an EMA is calculated is to start with the SMA formula. For an SMA, each data point is computed by dividing the sum of the values for the last “n” periods by the factor” n”. This basic arithmetical approach smooths out a typical pricing curve, but it is a lagging indicator that does not change quickly when the market is so inclined. The SMA, however, is often added to an oscillator like the Relative Strength Index (RSI) to provide a better visual representation of how prices are behaving.
To make the moving average more responsive to recent market changes, analysts came up with a weighting factor to make more recent prices have a heavier impact on the calculation. The EMA indicator is common on MetaTrader4 trading software. The calculation formula is more complex than for an SMA and follows these steps:
- Choose a “price” setting – assume “closing price.”
- Choose a “period” setting – assume “10”, for example.
- Calculate the “Smoothing Factor” = “SF” = 2/(1 + “10”).
- New EMA value = SF X New Price + (1- SF) X Previous EMA value.
To have a starting point EMA value, the first data point used is a simple moving average calculation. From that point on, the calculations proceed as detailed above. Fortunately, you do not have to be an expert statistician to avail yourself of the EMA indicator’s benefits. Software programs perform the necessary computational work and instantly portray the results on the chart as an overlay to the candlesticks. In our above example, the chart contains two EMA lines of differing periods. These two lines are often called a “ribbon”, but a single line can also be beneficial when planning a forex trading strategy.
There are no golden rules for choosing a period for a given EMA line. Every trader may have their individual preferences. Ribbon combinations can also vary, depending upon personal tastes, but general wisdom suggests that shorter periods be used when viewing shorter timeframes. For a day-trading 15-minute chart, you might prefer a “15/30” combination, whereas, for a daily chart, a “20/50” set of period settings might be more to your liking. Test various combinations during your practice trading sessions on your demo system to arrive at your preferences.
How to use the EMA Indicator in forex trading
The benefit of the EMA indicator is its visual simplicity. Traders can quickly assess the prevailing trend of price behaviour from the direction of the EMA. Care must be taken since the EMA is a lagging indicator and may not adjust rapidly to volatility in the market. The EMA indicator will respond more quickly than an SMA with similar settings since recent prices are given more weight.
The EMA works best when a strong trend is present over a long period, as in the above “GBP/USD” 15-Minute chart. The EMA “Red” line follows the upward trend, lagging below and forming an angled support line until the trend begins to reverse its direction. This indicator’s “lagging” tendency is emphasised in the latter portion of the chart when prices fell very quickly.
The period setting is “28” for the “Red” line in the above chart. The “Purple” line EMA has a setting of “13” and reacts more quickly.
There are several ways to employ the EMA for trading purposes. When a “ribbon” is used, the critical reference points are when the EMA crosses over the pricing candlesticks or another EMA. If prices are going up and a crossover occurs, that is viewed as a “Buy” signal and vice-versa. Alternatively, as the red line exhibits, a slow EMA is often regarded as support by investors.
As with any technical indicator, an EMA chart will never be 100% correct. False signals will prevail if an EMA is used in a ranging or sideways trending market, especially one with a short setting. False signals can occur, but the positives are consistent enough to give a forex trader an “edge”. Skill in interpreting and understanding EMA alerts must be developed over time. Complementing the EMA tool with another indicator is always recommended to confirm potential trend changes.
Related Articles
A simple EMA indicator trading strategy example
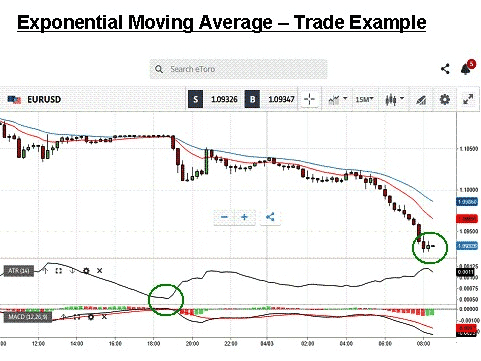
The following trading strategy example is for educational purposes only. Technical analysis takes previous pricing behaviour and attempts to forecast future prices. Still, there is always the warning that previous pricing behaviour, more often than not, can predict the future, but only to a degree. With that disclaimer at hand, the “Green” circles on the chart shown below illustrate optimal entry and exit points that can be discerned from using dual EMA lines as a guide.
Using the EMA with another technical indicator is also highly recommended. We have included an Average True Range (ATR) indicator and a Moving Average Convergence Divergence (MACD) indicator on this chart. The ATR can forecast oncoming market volatility, and the MACD can highlight both a trend and a momentum shift in market prices. Once again, demo practice can point you toward personal preferences.
A simple exponential moving average strategy would then be:
- Determine your entry point at the crossover when the “Red” EMA (15 period) crosses the slower “Blue” EMA (30 period) in an upward fashion.
- Execute a “Sell” order for no more than 2% to 3% of your account.
- Place a stop-loss order at 20 “pips” Above your entry point.
- Determine your exit point when the “Red” EMA crosses back through the “Blue” EMA in an upward direction.
In this example, the gap between the Red and Blue “ribbon” has not closed. The ATR is beginning to decline, a sign that investors may be pulling back, but the MACD has not closed. At the second “Green” circle, the trader could close his position and reap a gain of nearly 60 pips, but the signs are good for holding onto this trade. The candlesticks are well below the Blue line, and the signal from the MACD remains positive. As the old axiom states, “let the trend be your friend until it bends at the end.”
In this example, it is also worth noting that, when prices flattened in the first third of the chart, the EMA lines were of little use as a signalling basis. Ranging markets occur 70% of the time in the forex market, but you might also wonder what exponential moving averages do with stocks? They behave similarly. One of the benefits of technical analysis is that its principles apply in all financial markets with no adjustments necessary.
The Best Forex Demo Accounts
To master a new trading strategy – such as the EMA strategy we outlined above – you need to practice it. Reading the charts and timing your entry and exit points correctly are skills that need to be mastered in order to maximise your profits. This is where a forex demo account comes in: It allows you to practice your new strategy without risking any of your hard-won capital. Below we have picked out some of our favourite forex demo accounts
| Broker | Features | Regulator | Platforms | Next Step | |
|---|---|---|---|---|---|
 Your capital is at risk
Founded: 2014 Your capital is at risk
Founded: 2014 |
|
FSPR | MT4 | ||
 Your capital is at risk
Founded: 2006 Your capital is at risk
Founded: 2006Europe* CFDs ar... |
|
ASIC, FSA, FSB, MiFID | MetaTrader4, Sirix, AvaOptions, AvaTrader, Mirror Trader | ||
|
Between 74-89 % of retail investor accounts lose money when trading CFDs |
|
ASIC, FCA | MetaTrader 4, MetaTrader 5, cTrader | ||
|
|
|
CySEC, FSC, FSCA, MISA | MT4, MT5, OctaTrader | ||
|
|
|
ASIC, CySEC, IFSC | MT4 Terminal, MT4 for Mac, Web Trader, iPhone/iPad Trader, Droid Trader, Mobile Trader, MT5 | ||
 Your capital is at risk
Founded: 2006 Your capital is at risk
Founded: 2006 |
|
CySEC, DFSA, FCA, FSB, SIA | MetaTrader4, MetaTrader5, cTrader, FxPro Edge (Beta) | ||
Concluding Remarks
The Exponential Moving Average is one of the oldest and most popular tools in the TA toolkit. Even though it is classified as a lagging indicator, it has simplified the visual aspects of detecting a trend, given the trader a basis for holding a position, and then provided a worthy signal for concluding the trade.
There are alternative ways of applying the EMA, whether by itself or in tandem with another EMA of a differing period. The best way to utilise an EMA trading strategy is to practice first on a demo system, fine-tune its role in your routine, and then experiment with it in real-time. As with other indicators, an EMA is only one tool and is capable of false-positive alerts. It works best when combined with other indicators to form a more complete picture of the opportunity at hand.
Continue Learning
- More Forex Indicators Explained
- Demarker Indicator Explained
- The Momentum Indicator Explained
- Williams Percent Range Strategy

Forextraders' Broker of the Month
BlackBull Markets is a reliable and well-respected trading platform that provides its customers with high-quality access to a wide range of asset groups. The broker is headquartered in New Zealand which explains why it has flown under the radar for a few years but it is a great broker that is now building a global following. The BlackBull Markets site is intuitive and easy to use, making it an ideal choice for beginners.