Are you familiar with an ascending triangle formation and what it might mean in the context of forex trading? Veteran forex traders will tell you that the only way to win in the fickle forex market is to have an edge. You can tilt the odds in your favour by using indicators, learning to spot support and resistance levels, and recognising specific patterns and understanding what they might convey about future pricing behaviour. Ascending triangles are of this latter category.
An ascending triangle is one of three triangular possibilities that occur from time to time in the foreign exchange realm. There are descending, symmetrical and ascending triangles. Each suggests a convergence in investor sentiment and a potential breakout in the making, but an ascending triangle suggests that a prior positive trend has a high probability of continuing in the time periods to come.

Why learn about ascending triangles? If you take into account trading and spread costs, a forex trader must achieve a 55% win rate to just break even. In other words, you need to achieve a 60%+ winning rate in your home currency consistently if you want to stay in this game for any length of time. The ascending triangle pattern portends that a previous trend will continue, and analysts have determined that its success rate is roughly 83%, a worthy tilting of the odds in your favour.
An ascending triangle can form over several time periods, even days, weeks and months, but it is not perfect. It can give false positives, as with all patterns and indicators. However, it can give you an edge. In this article, you will learn the mechanics of an ascending triangle, its background and context, how to recognize it, and how to use it in your forex trading strategy going forward.
Background/Context for ascending triangles
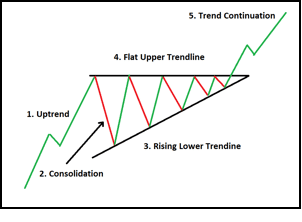
What is an ascending triangle? Let’s start with a diagram, courtesy of DailyFX.com:
The ascending triangle formation is known as a continuation pattern, since it typically follows an upward trend as it consolidates and then continues once more in the direction of the previous uptrend. This breakout follows a period of push and pull from buyers and sellers, with buyers slowly gaining the upper hand and then forcing the issue with a distinctive upward thrust.
The above diagram depicts the various components of this pattern. An ascending triangle is very similar to an ascending wedge, except for one characteristic: the ascending triangle has a flat upper trendline, while the ascending wedge has an upwardly sloping upper trendline. The upper line is stiff resistance, while the lower line displays increasing higher low values, a sign that buyers are slowly gaining strength for the inevitable breakout.
From the diagram, you can also see five downward swings and four upward swings before the breakout occurs. The literature for ascending triangles stipulates that there must be a minimum of two down and two up swings to constitute a valid pattern. The number of trendline touches can also be a signal for the strength of the breakout. The more time spent within the trendlines, the more coiled the spring, and the more powerful the breakout.
An upward breakout, however, is not always the case with this formation. About one out of six times, the buyers will run out of energy, and the sellers will take over, driving a downward thrust below the lower trendline. The reasons for this reversal can vary. The previous upward trend may have run its course, and the resistance may have been too stiff to allow any more gains at this time. Whichever the case, the odds still favour a positive move north.
Related Articles
Experienced forex traders are always on the lookout for this pattern and begin planning ahead for an eventual breakout in either direction. They are careful to place buy and sell orders at locations that can take advantage of a breakout in either direction. For traders familiar with the options arena, options are also a good way to win when this formation begins to appear.
Retail forex traders would also be wise to be wary at this stage. Institutional traders have been known to create a downward head-fake and then scoop up a host of stop-loss orders. This ‘scooping’ action can often drive the upward breakout that everyone was expecting, but the unwary individual trader may miss the action.
How do we know that the odds are favourable more than 80% of the time for an upward breakout when an ascending triangle forms? There are generally two types of patterns – either reversal or continuation. In either case, analysts have studied data archives in various markets to ascertain the propensity of each pattern to produce a dependable signal for an imminent pricing move.
Triangular patterns are common in our financial markets. Analysts have derived summary probabilities for the expected breakout, for the average price target, and for the odds for reaching the stipulated price target for each triangle pattern. You can rest assured that experienced traders will have taken note early on in the formation process for any triangle, whether ascending descending or symmetrical. You should recognize the same pricing pattern in order to align your trading strategy with what the pros are thinking.
For an ascending triangle, the odds are said to be 83% for an upward breakout. This figure represents a summary from all financial markets studied. As the forex market is very liquid with high turnover, we can expect a figure just a bit lower, but 80% is still a very green light. The price target is calculated by adding the width of the triangle at its greatest point to the resistance line value. Ascending triangle breakouts reach this target 70% of the time.
In the forex world, the odds for a descending triangle are comparable, as it only represents the currency pair’s price action from the opposite perspective. Symmetrical triangles tend to be less reliable, reflecting more uncertainty in the minds of investors. Symmetrical triangles also tend to form as a lead-up to an economic announcement or event where the outcome is in doubt. Learn to discern an ascending triangle in the making and to plan accordingly.
Examples
Patterns are a dependable gauge of investor sentiment and tell a story with a predictable outcome. The storyline does not always follow the playbook to the letter, but it does often enough to provide the necessary edge to win consistently in the forex market.
What is the psychology behind the ascending triangle? Let’s begin by reviewing the chart below, courtesy of eToro with our annotations added:
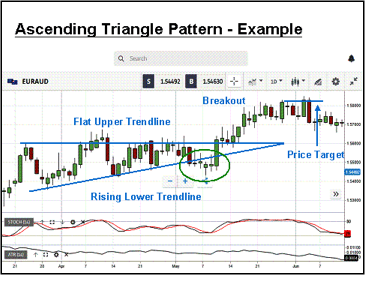
Here we have a daily chart for the EUR/AUD currency pair. Our annotations provide the details of this ascending triangle formation, along with its price target and the area to be wary of, enclosed by a green oval. The pattern follows an upward trend, shown on the left side of the chart. We have four low swing touches thereafter, as higher lows form along the rising lower trendline. After three upper swing touches, prices push through resistance on the fourth try.
The psychology of this formation is a familiar story between the bulls and the bears. After a strong upward trend, there is typically a pullback when profits are taken, but when the trend resumes, the bears take hold. Sellers push back, establishing a level of formidable resistance, but they are not strong enough to force lower lows. They cannot break the bulls’ resolve. The subsequent swing touches reflect a battle between the bulls and bears, with a slight tilt in favour of the bulls.
Eventually, the bulls win, about 80% of the time. There is a breakout, but only after declining volumes pick up again. The green oval demonstrates one pitfall to avoid when trading this pattern. Institutional traders are known to drive prices down to scoop up unwary stop-loss orders. These easy pickings then provide the fuel for the large upsurge, as depicted on the chart. Once the price target is met, prices begin another pullback phase, as the stochastics reveal.
Challenges With Trading the Ascending Triangle
There will always be the potential for false positive signals with ascending triangles, but the percentages for these occurrences are in the acceptable range. Price targets are also merely estimates, based on analysis. The strength of the trends at hand will dictate when pullbacks are in order. Institutional traders also like to throw their weight around in situations such as these. Be wary, place your stop-loss orders to avoid their games, and stay in the trade.
Conclusion
An ascending triangle is a continuation forex pattern and signals the potential resurgence of a previous strong upward trend. The bulls win this battle roughly 80% of the time, after a series of higher lows form beneath a ceiling of strong resistance. Like all other patterns and indicators, the ascending triangle is not perfect. It can signal false breakouts, but its signal is consistent enough to give you the edge you need to become a successful forex trader.

Forextraders' Broker of the Month
BlackBull Markets is a reliable and well-respected trading platform that provides its customers with high-quality access to a wide range of asset groups. The broker is headquartered in New Zealand which explains why it has flown under the radar for a few years but it is a great broker that is now building a global following. The BlackBull Markets site is intuitive and easy to use, making it an ideal choice for beginners.