

Trading options can seem complicated and risky, but it isn’t the only way to get benefits from the options market. The Put-Call Ratio (PCR) is one prime example of this. Experienced traders and investors use this ratio as a way of gauging investor sentiment and the possible future direction of prices in a specific market.
A “Put” option gives buyers the right to sell an asset at a specified price, while a “Call” option allows buyers to buy an asset at a fixed price. The ratio is calculated by dividing the number of traded put options by the number of traded call options, but the ratio doesn’t have to equal to 1. Equity investors tend to buy more Calls, such that the ratio is roughly 0.7. If this figure began to rise, then it could be an early indication that investors were about to take on a bearish tone. If the ratio declined below 0.7, then it could hint at a bullish trend in the making.
Being able to measure the mood of the market is key in finding setup opportunities, especially when trading forex currency pairs. The Put-Call Ratio can be a valuable tool for this process. In the article that follows, you will learn about this ratio, how it is calculated, how it can change, where to find it for your specific asset, and how investors and traders use it when planning their market strategies.
Background/Context of the put-call ratio
What is Put-Call Ratio? To fully understand this useful tool, it is best to start with the options market, and the largest derivative exchange in the world is provided by the CME Group (Chicago Mercantile Exchange). Options are the primary tool of choice for financial institutions, professional traders, and corporate treasury staff to hedge the financial risk in their asset portfolios. These assets would also include inherent currency risk in cross-border trade agreement contracts that extend over time.
While hedging may be the original intent, speculators have joined the fray to greatly enhance volume turnover and liquidity in the market. The CME offers over $100 billion in daily notational forex liquidity, ensuring tight Bid/Ask spreads and low trading costs. When buying these Put/Call contracts, the inherent risk is limited to the purchase price of the option, which is considerably less than the value of the underlying asset. The upside potential offers an opportunity for gain, but options trading tends to be more risk-laden than traditional forex trading.
The daily volume in Puts and Calls is fluid, and the changes in daily volume can highlight the fluctuating mood in investor sentiment ll. An investor will buy a Put when they want to lock in a selling price. A Call is used for the opposite effect, to lock in a buying price. The number of asset contracts outstanding at a given point in time is known as its Open Interest (OI). The Put-Call Ratio then becomes a ratio of Put-OI to Call-OI. When Puts are greater than Calls, the ratio will exceed 1 and suggest a bearish mindset. When the ratio is less than 1, the Bulls are outnumbering the Bears on an Open Interest basis.
Since Puts are the numerator and Calls are the denominator, the ratio does not say anything about volumes traded in total. For example, Open Interest Puts could remain the same, but if Calls increased or decreased, the ratio calculation would yield a different figure. The source of this option data is the daily trading report of the CME, which can be voluminous and difficult to assimilate. There are, however, other firms that produce more workable reports such as Optionistics.com, as shown in the example below.
A trader, however, need not participate in the options market to gain trading insights from it. The Put-Call Ratio is just one example that veteran traders use to confirm oversold and overbought conditions provided by chosen technical indicators. These indicators, based on previous pricing behaviour, cannot predict exactly when a reversal might occur. The Put-Call Ratio can add to your decision-making process, but as with all technical tools, this ratio is not perfect. Option traders can be just as wrong about market directions as retail forex traders, but over time, it can provide the edge necessary for success.
Related Articles
A Sample of an Optionistics Styled Report
Fortunately for traders, several data sources in the public domain offer Put-Call Option reports for easy access at little to no cost. The best ones are interactive. The firm we selected is Optionistics.com, and a graphic follows for the “EUR/USD” trading pair, which has been exhibiting a strong downtrend over the past several months:
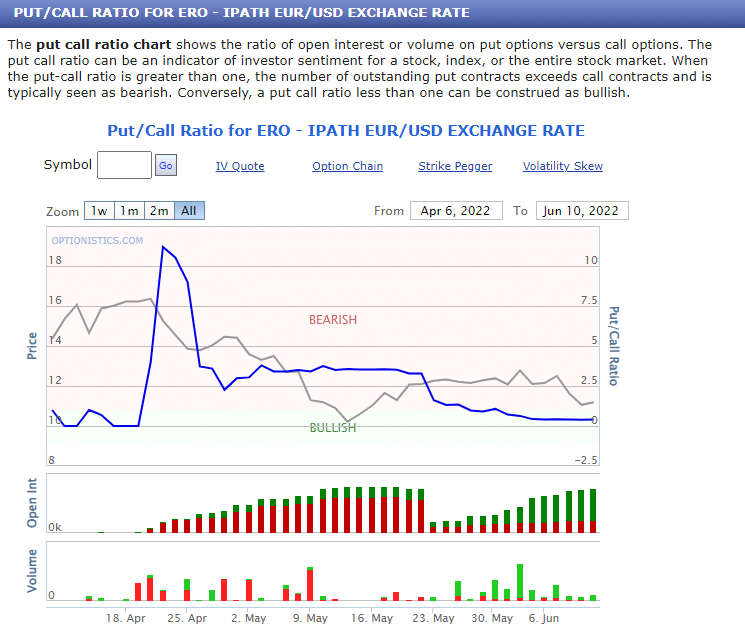
Graphic courtesy of Optionistics.com
The Blue line in the upper chart reflects the Put-Call Ratio with its scale to the right. The second chart is also a helpful histogram, which depicts Open Interest over time with Calls in Green. These show that the daily tide began to shift in favour of Call volume. On the 21st of April in 2022, the Put-OI was 347 versus Call-OI of 31 for a ratio of 11.2 (figures available from interactive feature). On the 10th of June, the ratio had declined to 0.4 with Put-OI at 421 and Call-OI at 1,048. Accordingly, investors are anticipating a potential reversal.
It’s important to keep in mind that open interest data is not updated on a real-time basis. Totals are typically adjusted for the day’s activity after the exchange has closed. The CME will publish the data the next morning, but there may be more delays for data aggregators that work with weekly data files. This lagging effect is more aligned with position or swing trading where the position may be over a series of days or weeks. Insights during the trading day for a day trader may not be available.
How to Use the Put-Call Ratio in a Trading Strategy
Traders in the options arena can be just as uninformed and wrong as any other traders in another forum. A herd mentality might persist as options trading requires a small amount of capital, where traders are more willing to guess when a market has hit a bottom or a peak. Studies have revealed that option traders are more likely to sustain losses on directional wagers.
Contrarian investors look specifically for assets that might be overvalued or undervalued. The PCR provides a tool for confirmation of these conditions. Veterans look for abrupt changes in the ratio, where sudden shifts are well above 1 or below 0.5. Two trading strategies have evolved over time:
- PCR Values are Normal: If PCR values hover closely to 1, it can confirm an ongoing trend. Traders have not decided if the trend is reaching an imminent reversal phase.
- PCR Values are Extreme: Values over 3 or below 0.5 suggest a reversal is imminent. Values in between these data points could indicate a continuation of the prevailing trend.
Examples
Caution is always advised when using PCR data. Interpretations may vary for current conditions, especially when compared to previous patterns under similar circumstances. As a case in point, the “EUR/USD” currency pair has been trending down for the past several months, as the USD strengthened following the Fed’s hawkish stance. For example purposes, let’s review a daily “EUR/USD” chart presentation:
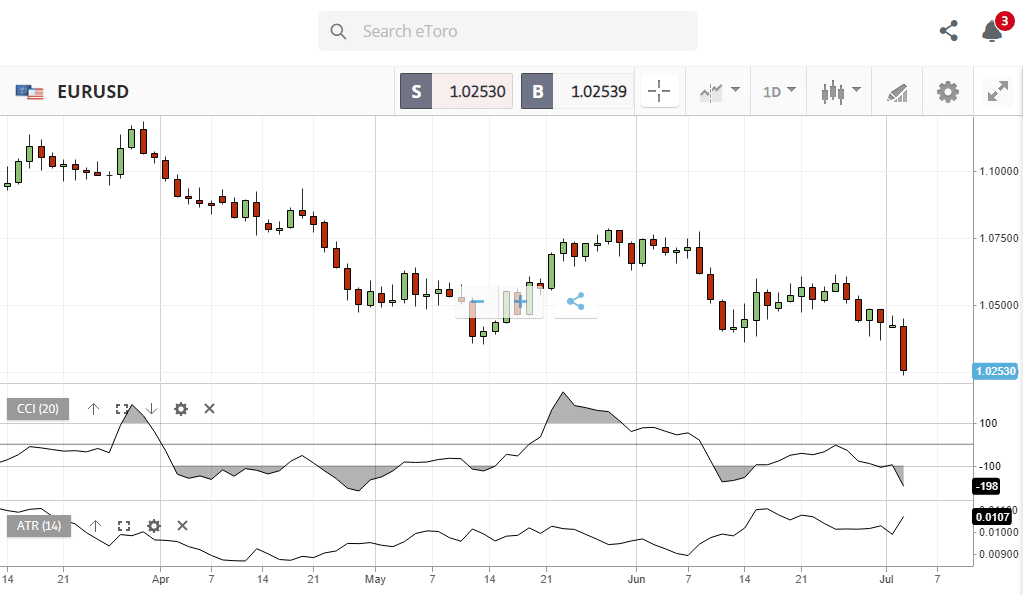
Chart courtesy of eToro.com
The downtrend began in the first week of April 2022, but the PCR did not react for two weeks. The reaction was a sharp spike, and Puts then ruled the day for weeks until the third Friday in May. Option expiration dates typically fall on the third Friday of the month, another reason to be cautious when using the PCR. In this case, the PCR exited Bearish territory, as profit-taking took hold and ranging behaviour commenced.
Conclusion
The Put-Call Ratio or PCR is an important tool in the trader’s technical toolbox. Veteran traders use it as additional confirmation for overbought and oversold conditions and for insights as to when to expect a potential market reversal in pricing behaviour. The CME Group oversees the largest derivatives exchange market in the world and is the central source for PCR data, but several data aggregators produce useful reports. There is, however, a lagging quality to the information.
These reports can help provide guidance for potential trend reversals or the continuation of existing trend lines. The PCR is useful, but it is not infallible. If used in tandem with other technical tools, it can signal a change in the mood of the market, which can add to your basic decision-making process. Reviewing current charts with previous pricing activity can help traders become comfortable with its usage and incorporate its alerts into a daily trading regimen.

Forextraders' Broker of the Month
BlackBull Markets is a reliable and well-respected trading platform that provides its customers with high-quality access to a wide range of asset groups. The broker is headquartered in New Zealand which explains why it has flown under the radar for a few years but it is a great broker that is now building a global following. The BlackBull Markets site is intuitive and easy to use, making it an ideal choice for beginners.