

First introduced in 2010, cTrader has grown to become one of the most popular platforms for trading forex. This premium product has many market-leading features and is typically offered by high-end brokers who are well-regarded in the investment community.
Traders can use cTrader to carry out research, book trades, manage risk, and monitor portfolio performance. Given the array of powerful software features and the platform’s capacity for enhancing your trading performance, there is value to be gained by understanding the platform’s full potential and learning how to use cTrader in a way that suits your trading style.
cTrader Charts
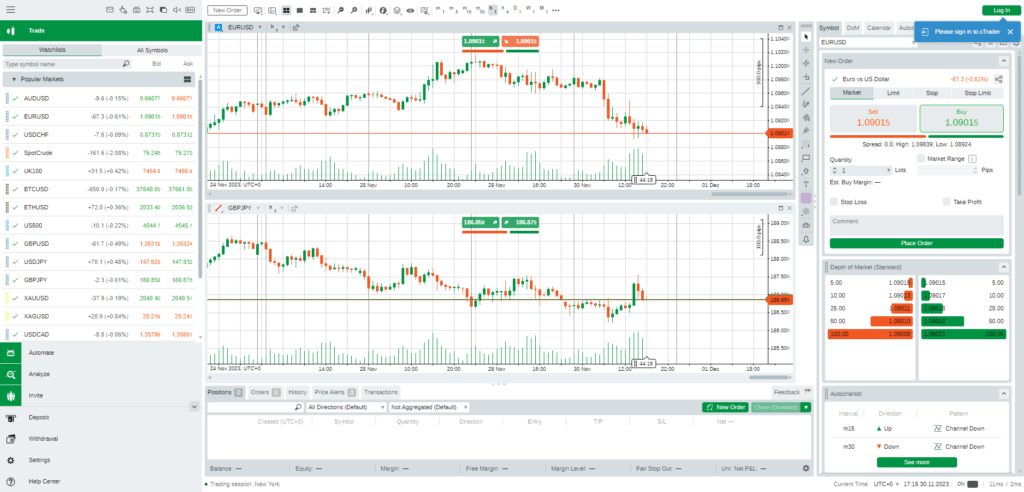
Created by trading software specialists Spotware Systems Ltd, the cTrader trading dashboard is offered under licence to brokers who, in turn, allow their clients to use it to access the markets. Some of the most attractive features of the cTrader platform relate to the research and analysis tools and the versatility of the price charts, which make up the core area of the trading dashboard.
The all-round package has been set up to give traders the tools they need to have confidence when entering the forex markets. However, given the array of powerful software indicators available, it is advisable to gain an understanding of how they can help your trading.
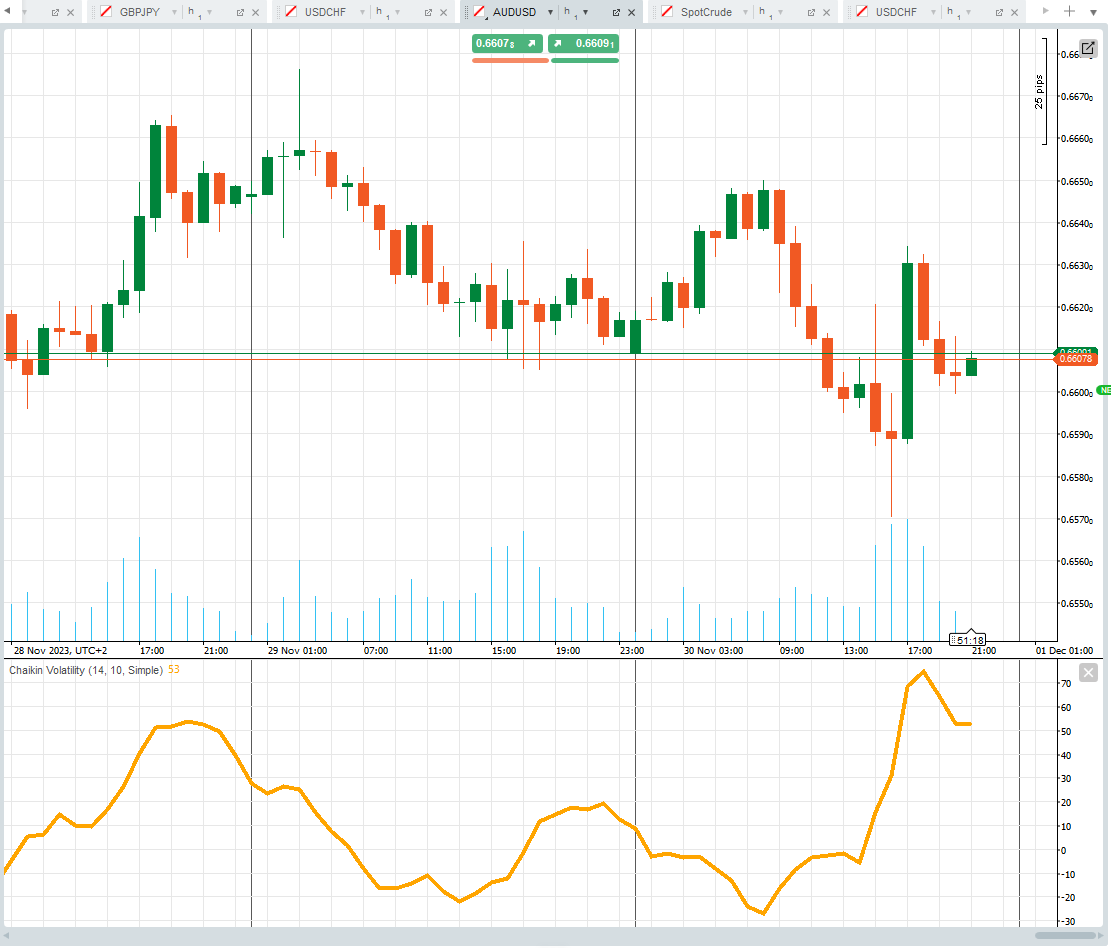
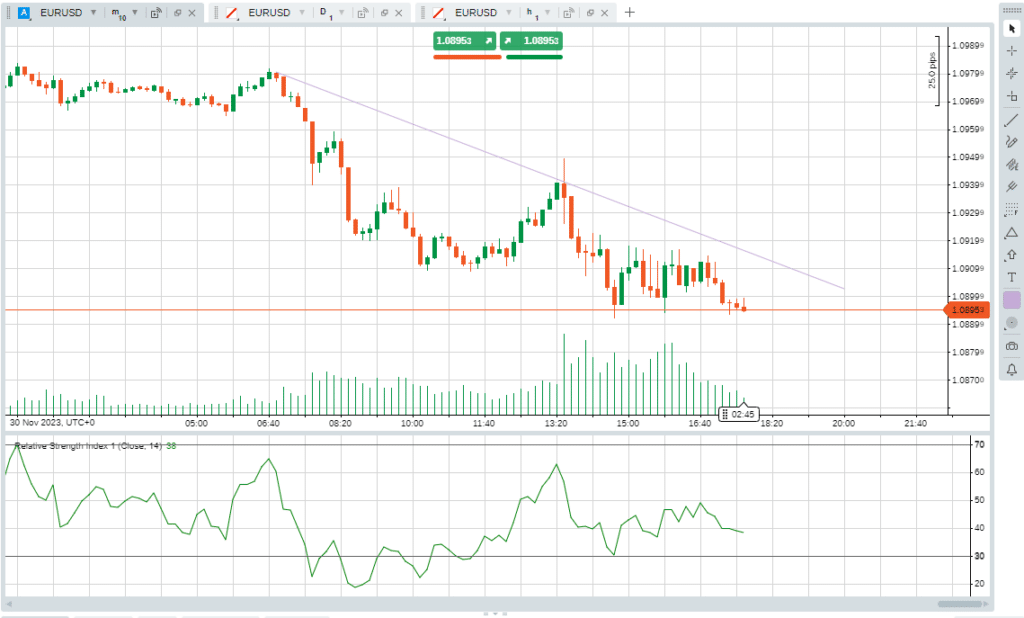
The centrepiece of the cTrader dashboard comprises a highly versatile monitor that can host one or more price charts. Each monitor can be set to a different time frame, so it is possible to simultaneously track price moves in AUDUSD and NZDUSD or consider the trends forming in one currency pair over a selection of time frames, ranging in duration from seconds to months.
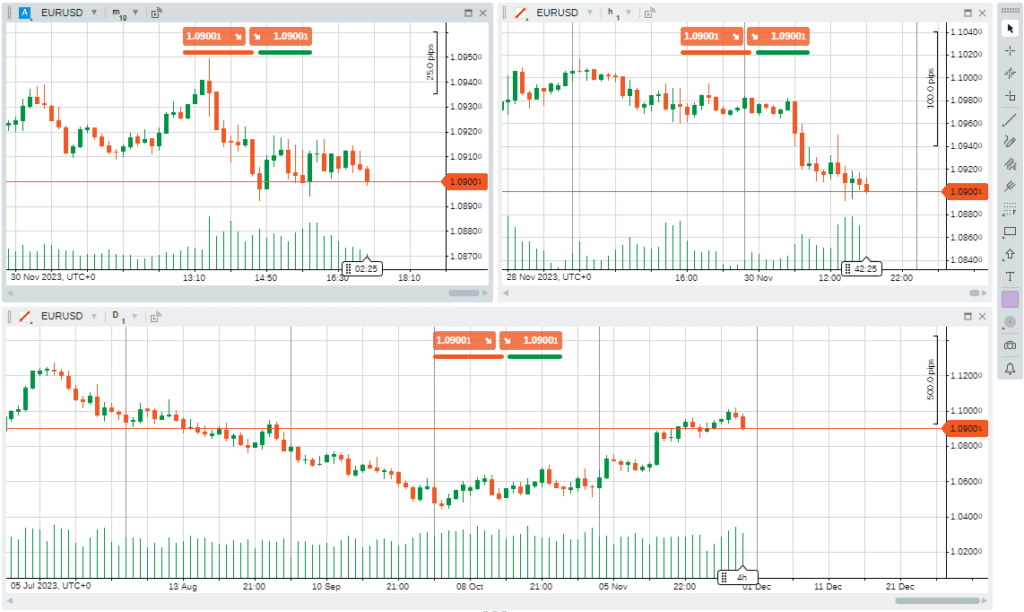
If you’re focusing on one market and using charting techniques, you can expand the relevant price chart to full-screen mode to make applying indicators, trendlines, and other research-based graphics easier. That versatility extends to hiding the dashboard’s sidebars to create an even larger price chart monitor. When you’re happy with your new customised visual display, it’s possible to save that format so that it can be used on any occasion. There is also the option to set the screen graphics to a light or dark colour scheme.
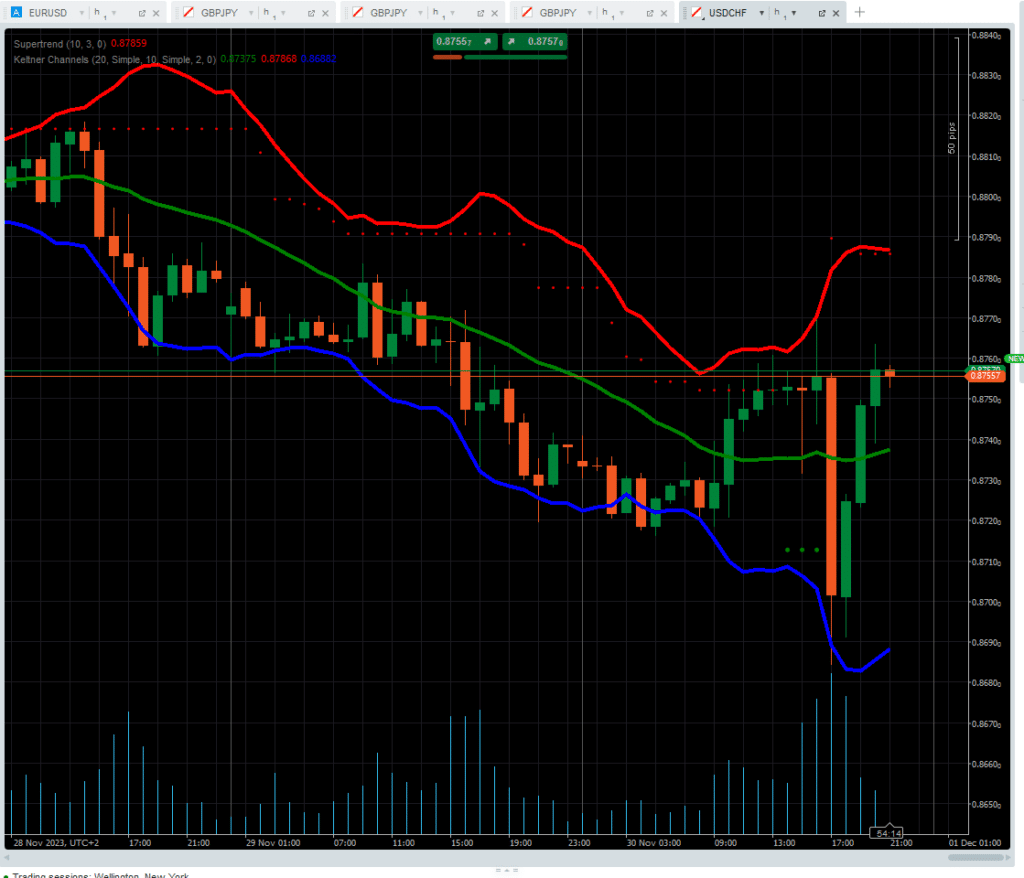
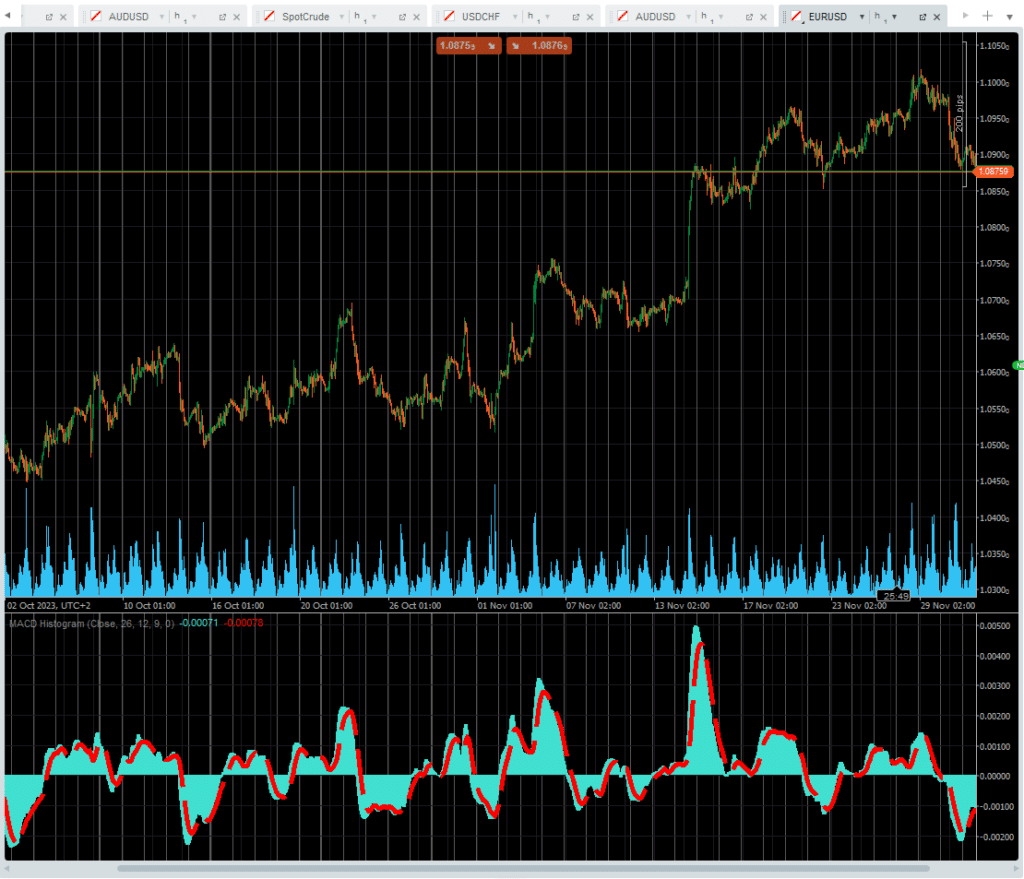
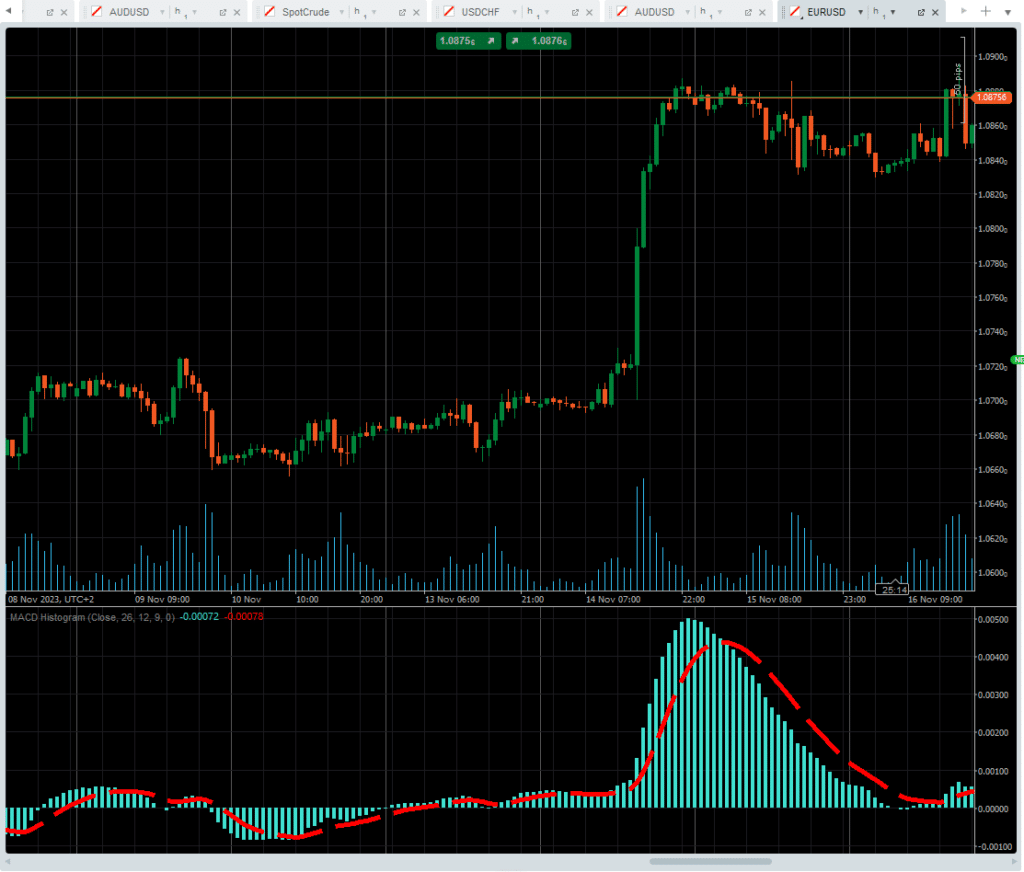
More than 50 trading indicators are provided as part of the default cTrader package. These graphical aids can be used to detect pricing anomalies, new trends, spikes in volatility, and lots more market events which constitute trading opportunities for those who identify them.
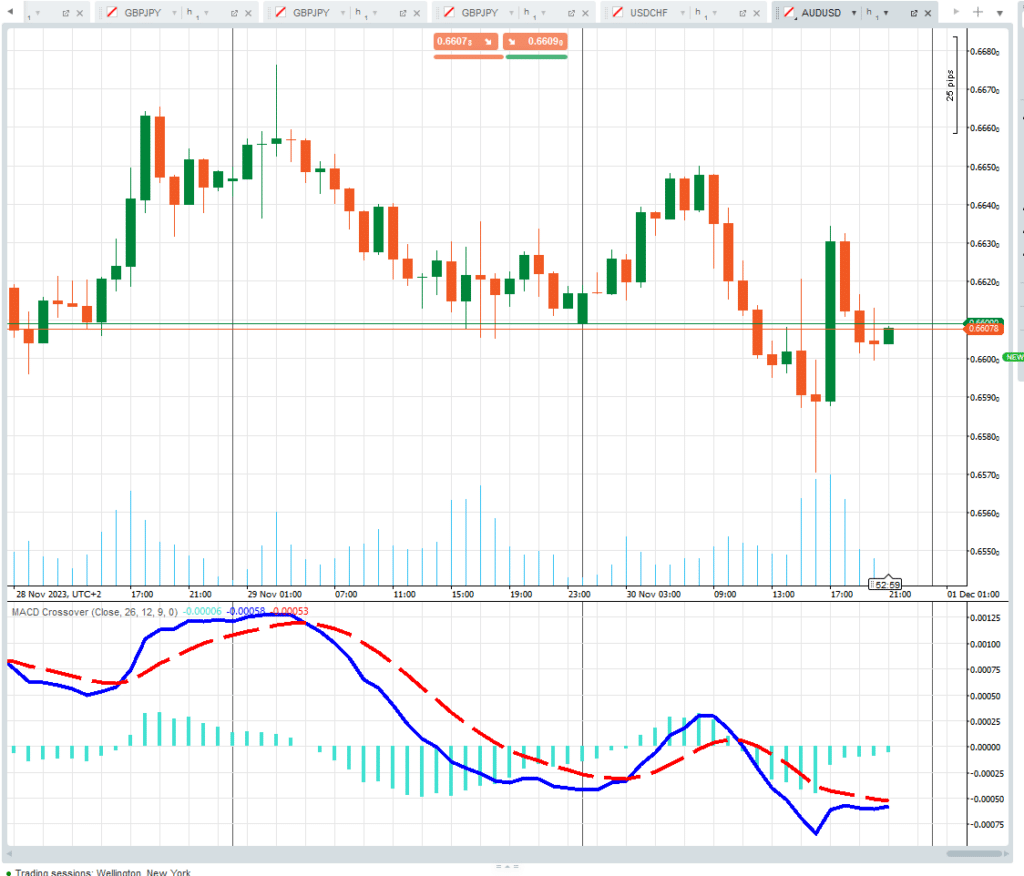
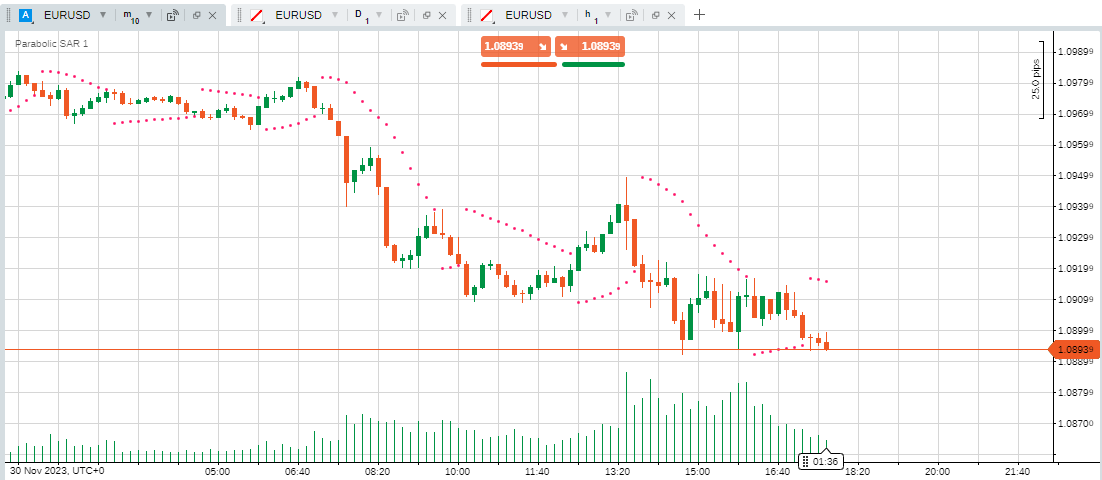
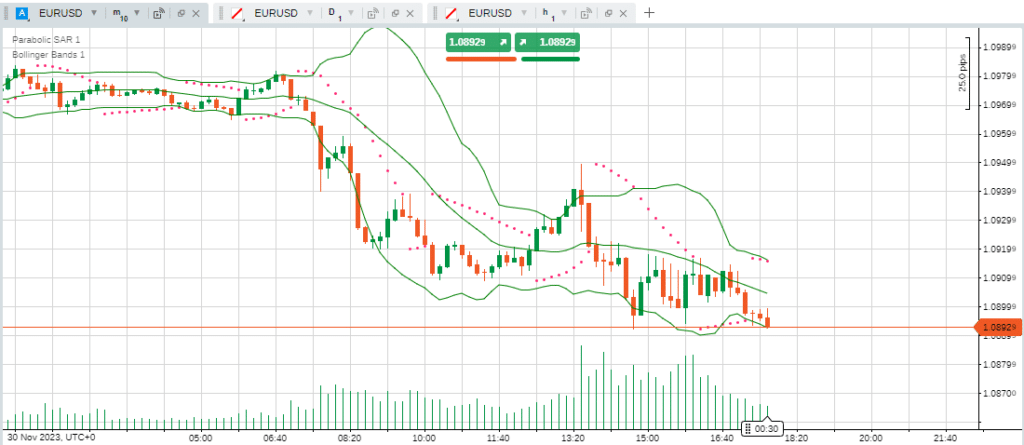
To help simplify the selection process, different indicators are categorised into four sub-groups which relate to styles of trading. Trend monitors include Accumulative Swing Index and Parabolic SAR, and the Volatility section includes Keltner Channels and Bollinger Bands. The Volume and Oscillator categories contain indicators including On Balance Volume and Chaikin Money Flow, MACD Crossover and Relative Strength Index, respectively. When clicked on, some will be applied in the main price chart; others will appear in a separate monitor below the price chart.
There are two ways to locate and apply an indicator to a price chart. The first is to hover over a chart monitor, right-click, and select Indicators. That will bring up the list of available indicators, which will be applied to the price chart in question at another click of a button. If you’re opting to view price charts in full-screen mode, then the list of Indicators can be accessed by clicking on the appropriate icon in the top toolbar, which then shows indicators in a drop-down list.
The metrics of each indicator can be adjusted to create a tool specifically designed for the strategy and time frame you are trading, with shorter timescales being more appropriate to day trading strategies, which involve moving in and out of positions more frequently.
cTrader Indicators
Beginners or experienced traders with limited time to devote to research and analysis can take advantage of the cTrader Autochartist tool. It does a lot of the groundwork required for effective research and can save cTrader clients hours that would be spent on in-depth analysis. It scans markets using pattern recognition software to identify instances where price movements have set up a particular technical analysis trading pattern. It states a view on which direction price might next head.
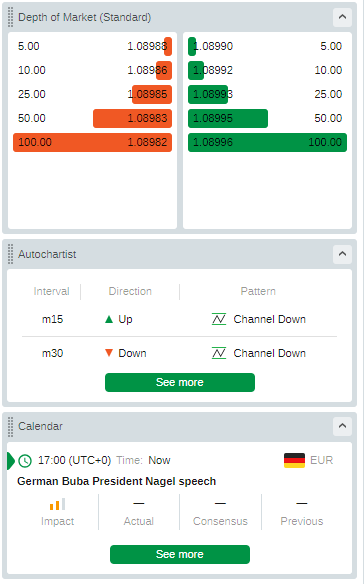
If your cTrader broker offers Autochartist as part of your account, double-clicking on any highlighted patterns listed in the Autochartist monitor will create a pop-up window. That gives more information on the trading pattern in question and the Autochartist analysis used to generate the trade indicator. The graphic will explain the criteria, such as price support and resistance levels, Fibonacci levels, or other technical indicators, which have been used to spot the trading opportunity. With a lot of the hard work already done by Autochartist, it is then up to cTrader clients to decide whether to use it as a framework for further research or to book a trade off Autochartist’s analysis, which will indicate ‘buy’ or ‘sell.’
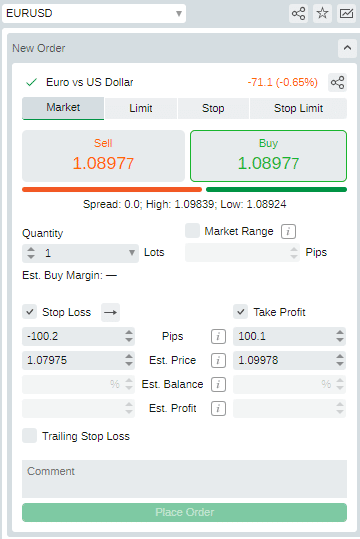
How to make a trade on cTrader
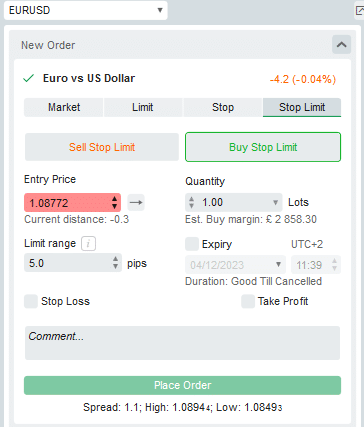
The trade execution interface at cTrader follows the tried and tested format of most trading platforms. The simplest way to book a trade in EURUSD, GBPUSD, or USDJPY is to right-click the price chart of the currency you want to trade and then click Create Order. You then enter the amount you wish to trade into the Quantity data field and click Buy or Sell.
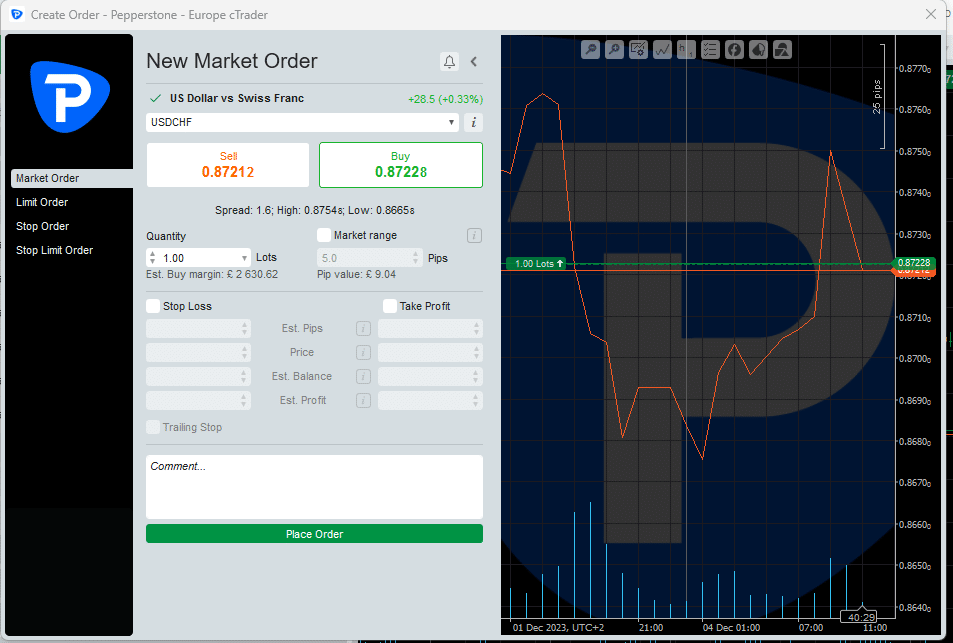
All the necessary instructions, such as Stop Loss, Trailing Stop, and Take Profit orders, can be input before sending the instruction into the market, which allows you to create an appropriate risk management framework before executing the trade.
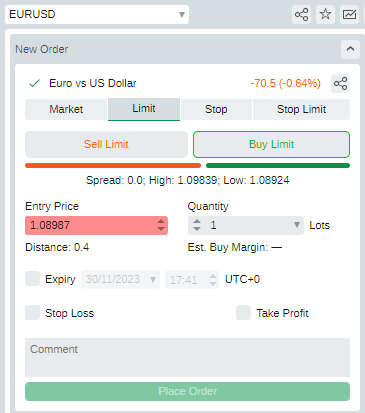
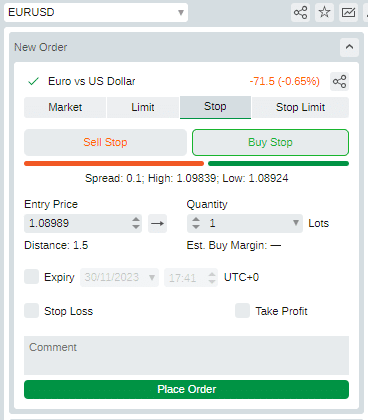
There is also room for creating orders to be executed when price reaches a certain level. These Limit, Stop, and Stop Limit orders allow you to instil more discipline into your trading approach, enabling you to optimise the levels at which you buy and sell currencies.
It is also possible to book the entire range of trade types using the Trade Order monitor, which, when the platform is formatted in line with the default settings, can be found in the top right corner of the dashboard. Once you’ve familiarised yourself with the basics of trade execution, you can take advantage of how the dashboard can be personalised. Different monitors can be detached, enlarged, or set out in multi-screen format. If having a price chart in full-screen mode is your priority, then the New Order monitor can be removed from the dashboard display and instead set to be accessed via a drop-down menu.
The forex markets are a natural fit for systematic/algorithmic trading strategies. These allow traders to build models that automatically buy and sell currencies at predetermined price levels, which means traders don’t have to monitor screens 24/7 and that the pitfalls of emotional trading are avoided.
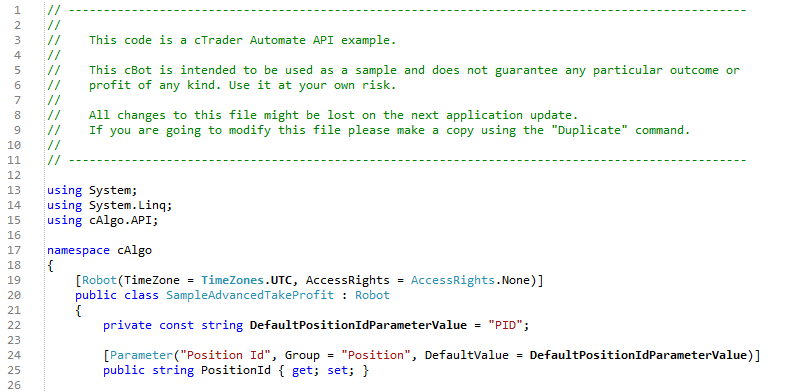
The cTrader Automate tool is free, and users are not bound by any contractual obligations. The simplest way to automate your trading is to navigate to the Automate section of the left-hand toolbar and select a cBot designed to be applied to a particular trading scenario. You input the parameters you want the model to follow, and that instruction will be sent directly to the market via cTrader’s industry standard FIX API connections linked with seven of the world’s largest currency exchanges.
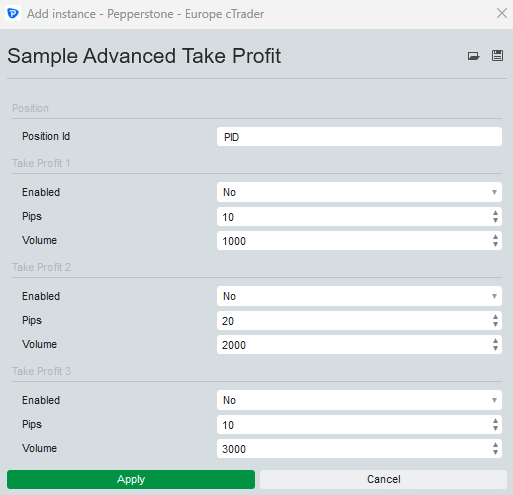
Moving into automated trading isn’t the top priority for many beginners, but the user-friendly nature of the cBot service could tempt some to try it out. Designed with simplicity in mind, cTrader Automate seamlessly connects to a trader’s manual trading and charting features. That breaks down the usual barrier to entry of traders having to learn a new computer program to create models. Using the C# language to write bespoke code is an alternative option for more advanced traders.
How to monitor positions
Stop loss and take profit orders can be added to open positions after execution has taken place and adjusted on an ongoing basis. That accommodates traders active in fast-moving markets that need to book trades first and set risk limits later.
Adjusting the parameters of an open position is done by accessing the portfolio monitor of the platform and clicking on the relevant position. That same portfolio section also provides P&L readings on itemised positions and the overall portfolio as live market prices feed into the cTrader system. It is also the area of the platform to navigate to when the time comes to close positions, with cTrader allowing you to close out all or some of a position.
There are few opportunities for cTrader to come up with neat features and break new ground in the portfolio section of the platform. P&L reporting is best kept simple and has relatively limited and standardised functionality. One area where there is value-added by the platform is the cTrader Analyze service. It allows traders to carry out post-trade analysis of their own trading decisions. Good and bad trades can be reviewed, filtered, assessed, and used as a guide for improving future strategies.
Popular indicators available at cTrader include
Trend | Volatility | Oscillators | Volume |
Aroon | ATR | Accelerator | Chaikin Money Flow |
Average Directional Movement | Bollinger Bands | Commodity Channel Index | Ease of Movement |
EMA | Historic Vol | Linear Regression | On Balance Volume |
Hull Moving Average | Linear Regression | MACD Histogram | Price Volume Trend |
SMA | Donchan Channel | MACD Crossover | Tick Volume |
Supertrend | Polynormal Regression | Momentum Calculator | Trade Volume Index |
Triangular Moving Average | Standard Deviation | Price ROC | Volume Oscillator |
WMA | True Range | TRIX | Volume ROC |
The Best cTrader Brokers
Once you’ve established that the many positive features of cTrader are a good fit for your style of trading, the next step is to find a broker that offers the markets and T&Cs that suit your strategy. cTrader isn’t offered as widely as some other platforms, such as the ubiquitous MT4, but those brokers who do offer cTrader tend to be high-end firms that see the platform as a natural fit for their professional-grade service.
It is worth noting that as cTrader is a third-party system, each broker will decide which of the many features are included in the package they offer their clients. If a particular metric, such as Depth of Market or Autochartist, is vital to you, then checking it comes as part of a broker’s default package makes sense.
Related Articles:
- The Best cTrader Brokers
- cTrader vs MT4 – What Are the Differences?
- MT4 vs MT5 – What are the Differences?
- Choosing A Forex Broker
Final Thoughts
It’s not surprising that cTrader won the online trading platform of the year award in 2018. Its ability to incorporate advanced trading tools into an easy-to-use format makes it an ideal choice for beginners and advanced traders.
It takes moments to set up an account with a cTrader broker. Once you’ve grasped the basics, the scope for personal development means you could be set up on a platform which can support your trading in whatever markets and strategies you utilise in the future. That removes the need to set up and learn how a different platform works; instead, cTrader allows beginners to start their trading at a level appropriate to them and, over time, seamlessly incorporate more advanced tools into their way of trading.

Forextraders' Broker of the Month
BlackBull Markets is a reliable and well-respected trading platform that provides its customers with high-quality access to a wide range of asset groups. The broker is headquartered in New Zealand which explains why it has flown under the radar for a few years but it is a great broker that is now building a global following. The BlackBull Markets site is intuitive and easy to use, making it an ideal choice for beginners.