Technical indicators are utilized by traders in the same way that price patterns are. In the case of indicators the purpose is to give the chaotic jumble of prices and quotes some resemblance of order through the employment of simple mathematical tools. While the idea of engaging in mathematics may sound intimidating to many at first, all of these indicators have been standardized through the years, and the trading software that draws them will in general leave little discretion to the user. The mathematical formulas themselves are usually simple and straightforward, and some high school mathematics is the most that is needed to understand why and how are they are constructed.
How many indicators should we use? Which indicator is the best for evaluating a chart? These are the questions that often confuse the inexperienced trader, and leads the experienced trader to claim that trading is an art and not a science.
Let’s try to answer those questions one by one:
How many indicators should a trader use?
The answer to this is not as difficult as it seems at first glance. It can’t be denied that the more indicators there are on the computer screen, the more information is available for the trader. Moving averages of different time periods, for instance, can provide a good signal for determining the next obstacle, the next support and resistance levels for the price.
But the question is, how much information does the trader need? Does he aim at making quick profits on an intraday basis? Or, does he aim at making profits from monthly movements? Obviously, a long term investor has very little use for a 3-hour moving average.
And beyond these questions, how much information is the trader able to evaluate meaningfully before losing focus and being lost in meaningless mental discussions about whether this or that indicator gives the right signals?
Naturally, people will have differing answers to these questions based on personal experience, and there’s nothing wrong about that, as many of the indicators themselves are the same tools disguised in slightly differing formulae. It’s very hard to decide whether the RSI or Stochastics is more accurate in giving signals, but it’s not that hard to claim that what they do is by and large the same thing.
Simplicity and clarity, as in everything else, are the best pieces of advice that a beginning forex trader can pocket from this discussion.
Which indicator is the best for evaluating a chart?
To this, the answer is rather simple: none. While it’s true that for different types of charts, different types of indicators can have more significance (such as the RSI being more suitable for ranging markets), the best method probably is taking one of each type of indicator (oscillator, moving averages, and so on) and combining them to get as complete a picture as possible about the current state of the market through the use of technical analysis.
Let’s briefly examine the four major indicator classes most often encountered in forex:
1. Oscillators
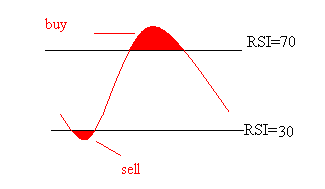
The relative strength index (RSI), or Stochastics are called oscillators because they move back and forth (oscillate) between two fixed points. In general, the forex oscillators move back and forth between overbought and oversold levels, and the signals they generate are most useful in range-bound markets. To give an example, the most popular and common of oscillators, the RSI, will give a buy signal when the indicators value is below 30, and a sell signal when the value is above 70.
Most charting software provided by forex brokers include the capability to plot all kinds of oscillators on the price. Since oscillators of the same kind can give conflicting signals, it is perhaps a good idea to use only one oscillator in evaluating a single chart. In fact, since a large part of the perceived effectiveness of technical tools is the result of their wide-spread usage by traders, it’s not advisable to use a rare, obscure technical tool, however convinced the user may be of its effectiveness.
Oscillators are leading indicators, in that they’re supposed to give advance warning of a change in the direction of the price movement. How valid the signals they give are depends on the liquidity of the market and price pattern. In an environment of poor liquidity (like Christmas week, when most people are on vacation), the signals emitted by these indicators are likely to be almost useless, because a sudden and relatively small injection of liquidity is highly likely to disrupt the oscillator’s scenario. Similarly, in a strongly trending market, the RSI can touch 70, 80, and even higher levels without the much anticipated counter-trend movement materializing. Learn more about oscillator indicators.
2. Moving Averages
We have mentioned several times that the price movements on a typical day are chaotic and unpredictable. The purpose of the various kinds of moving averages is to smooth out those fluctuations, and to provide the trader with a more easily evaluated picture of the trend. Moving averages can also be said to identify trends automatically: While in drawing trend lines, the trader has to use a lot of discretion in deciding which price movement is significant and which is not — the moving average simply takes all the available data and creates the trend.
The two most usual kinds of moving averages — simple and exponential — are calculated in a similar way, but with one little difference: The simple moving average adds all the closing prices together and divides them by the number of the periods (days, hours, etc). As data is updated, the average changes (that is, moves) and the indicator is thus plotted out on our screens. In calculating the SMA, all the data from different time periods are weighted equally: Yesterday’s price is just as important as the closing price of three months ago. But in calculating EMA (exponential moving average) a simple mathematical formula grants greater value to the prices of the most recent time period, and therefore recent values are emphasized.
There are many ways of making use of these indicators. For illustration purposes we’ll consider the moving average crossover method which is often used for determining entry and exit points.
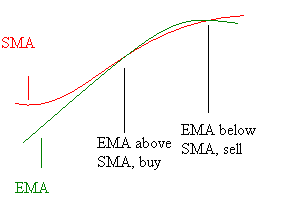
Because the EMA values the most recent periods more, and thus is more sensitive to recent price changes, the trader using the crossover method will use those occasions when the EMA makes an outsized movement in either direction in comparison the SMA as entry and exit points. That is, when the EMA moves faster than the SMA, and crosses below or under the SMA line, the trader will make an attempt at opening a position if all his other conditions (fundamental, technical) are also met. More about the simple moving average. More about the exponential moving average.
3. Pivot Points
Pivot point are calculated by taking the average of the previous high, low, and closing prices, but as with most technical indicators, there are a lot of different ways and approaches to calculating them. Fortunately, as forex brokers provide charting services that perform these calculations in place of the trader, all we need to discuss here is how technical analysts use pivot points to predict future price movements.
Technical analysis contends that if the pivot point is broken in an upward direction, the short term signal is that a new trend is being established, or at least that a short term bullish movement is underway, and vice versa if the pivot point is broken in the opposite direction. Another usage of the pivot point that we must mention is in determining the trigger point for a new trade or limit/stop order. Since the pivot point is considered the most important support and resistance point, it can be utilized as profit taking target, or a convenient price level for a stop loss order.
Pivot points are short term indicators, and must be updated each day with the incoming data. All other things being equal, the technically-minded trader will expect the greatest price fluctuations to occur at the pivot point, and the other technical support or resistance levels are expected to be of minor significance in comparison.
4. Fibonacci
Fibonacci numbers, discovered in the 15th century by an Italian mathematician, are numerical patterns found throughout the nature in everything from the structure of leaves to patterns of sea waves.
But we’re only concerned with this mathematical curiosity in as much as it bears on our trading experience, and that’s where we’ll need to consider the Fibonacci retracement and extension levels.
Fibonacci retracement occurs when the market reacts to a price movement in the course of a trend with a movement on the opposite side, with the size of the opposite movement defined through multiplication with the Fibonacci numbers of 0.38, 0.5 and 0.61. These levels can be drawn by the charting software offered by the broker, and the trader should only know the existence of the various levels and their significance in determining the size of the usually temporary reversals. Fibonacci extension is the opposite of retracement: During the course of a continuing trend, the size of the next leg of the trend can often be calculated by multiplying the size of the previous leg with one of the Fibonacci numbers.
The reader should not worry at all if that description sounds complicated. The best way to learn about extension and retracement is practicing on the charting software with a game or mini account offered by the broker. All that you need to keep in mind is that the size of the extension or reversal is only clear in hindsight: There’s no way of knowing which of the three Fibonacci numbers we mentioned above will determine the size of the oncoming reaction or continuation.
Key Points
- Technical indicators are tools used by traders to make sense of price quotes
- Which indicators to use, and how many, depends on the individual trader and their chosen strategy.
- Oscillators move back and forth between two fixed points. They are used to detect overbought and oversold market conditions.
- Moving averages smooth out fluctuations in price and present a clearer picture of the overall trend.
- Pivot point are calculated by taking the average of the previous high, low, and closing prices. There are several ways of calculating and using them
- Fibonacci levels are based on the number sequence discovered by the famous Italian mathematician.
Further Reading
More Free Forex Lessons
subscribe to get a FREE BONUS LESSON, plus course updates, trade ideas and market news - straight to your inbox

Forextraders' Broker of the Month
BlackBull Markets is a reliable and well-respected trading platform that provides its customers with high-quality access to a wide range of asset groups. The broker is headquartered in New Zealand which explains why it has flown under the radar for a few years but it is a great broker that is now building a global following. The BlackBull Markets site is intuitive and easy to use, making it an ideal choice for beginners.