With each passing week and month, it is getting more and more difficult to find any optimists out there in the analyst community. For every one thing that looks positive, there seem to be two or three other items that cause concern in a number of quarters. For anyone that had the chutzpa to invest back during the Great Recession before a recovery was a dead certainty, the rewards have been great. Major investment firms continue to wax eloquently about this market, suggesting caution, but urging all to stay invested in order to eke out the last drops of alpha in this Bull market’s bottle of spirits.
But when is enough really enough? When do you pull the plug, wait on the sidelines, and then plug in again for the long haul? Many investors and analysts have been asking these same questions for quite some time, yet the narrative supports sticking with it. At some point, logic says that gravity must take over, but have our central bankers tied so many knots in the global economy’s infrastructure that it, too, is held hostage to a slow growth scenario that could go on for ad infinitum? Attempts to find a “silver bullet” chart, one that all could agree was a penultimate forecasting gem, have been fruitless, but the lack of results in this effort has not deterred the faithful from continuing their search.
At some point, the dreaded correction will occur, or worse yet, a “Black Swan” event of devilish proportions. For the time being, however, investors that did profit handsomely over the past eight years can only gloat when presented with the chart below:
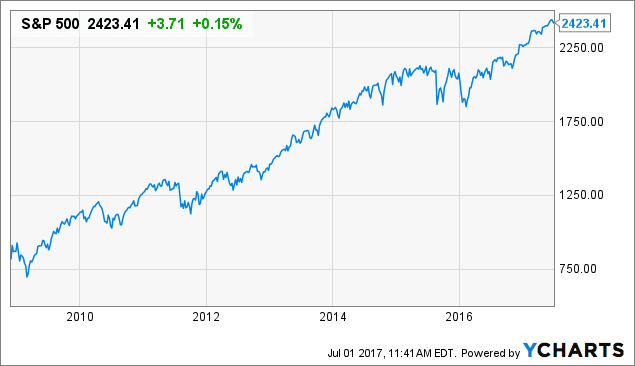
Yes, a simple tripling of your investment over the time period depicted above is what investing is all about, but do you risk losing half of your account balance by remaining in the market for too long? The vast majority of money managers would discourage trading or trying to time a top in the market. You would likely hear the time honored counsel that you must invest for the long haul. Buy from a value perspective, and ignore the whims of the market in the short run. Wise advice for sure, but these same investment houses are busy in their back offices trading as if their lives depended on it, hedging high risk positions as best they can, and squeezing out portfolio profits before it is too late.
The latest scare has been with the best of the high-tech sector. These monsters of the market hold up various indices by their shear weight, but cracks in high flyers can only mean earthquakes down below where the pickings are scarcer indeed. Google, Amazon, Netflix, Cisco, and Microsoft – Each of these powerhouses have suddenly succumbed to technical weakness. If it is not a Double Top, and a declining one at that, then it is an awesome Head-and Shoulders formation that signals doom in the near term.
What concerns are being raised? Per one analyst: “Consistent weakness in some of the largest components of the Tech sector – this is a warning for the broader market. Like the market in 2000, which was driven by a narrow group of stocks, when that group falters the market sentiment can shift rapidly. With the Fed tightening, stocks at stratospheric valuations and geo-political risk at the greatest level in decades it is time to reduce equity exposure and for the brave at heart – get short.” Hmm, sounds like a plan!
Read more forex news and forecasts
How has the S&P 500 index, our best global composite indicator, fared?
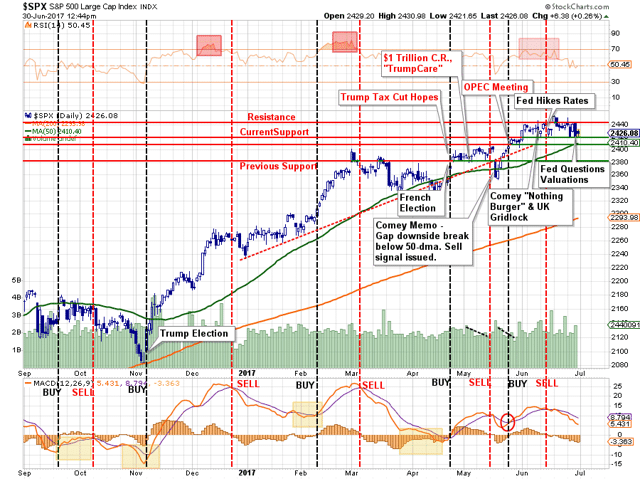
This fully annotated chart of the S&P 500 for the past ten months may appear to be over done to the extreme, but one like it has more than likely been present on the desks or computer screens of every analyst employed by one of our major investment houses. The last month, the same 30-day period when the tech sector began signaling problems, has not been stupendous from anyone’s perspective. The Head-and Shoulder pattern is apparent and portends a fall to the previous support line at 2380, but a 3% decline is by no means a correction. What is all of the hoopla about anyway?
For you traders out there, the MACD indicator has certainly delivered timely and correct Buy/Sell signals since September of 2016. The last Sell signal was before mid-month in June, but the jury is out as to when the next Buy crossover will occur. Is the air out of this balloon? Analysts, however, have noticed greater ebbs and flows in the NASDAQ, where 5% drops are more the norm. Observers in this arena, the 100 top technology stocks, are expecting more downside this week. Yes, tech stocks had their best first half of the year since 2009, but the road ahead is filled with obstacles and headwinds.
When you try to dig deeper into this puzzle that pins our hopes and dreams on tech stock behavior, you quickly run into “technical speak” of a higher order. It seems that a multitude of money managers have converged together upon a strategy that seeks to invest only in low volatility stocks, the goal being that stability and steady earnings will deliver the goods in the end. The problem, from a technician’s perspective, is that high-tech stocks currently have implied volatility values that are significantly below the VIX, a fact that may have pumped up values in this sector for all of the wrong reasons. What will happen when there is a slight reversion to the mean and these same managers suddenly jettison tech stocks to achieve their artificially mandated rules for success?
What are foreign currencies telling us about what will happen next?
As with stocks, volatility indices with respect to major pairings have been lower than low, as if traders in unison had decided to take a break. Surprisingly enough, most all major pairings, with perhaps the exception of the USD/JPY coupling, are exactly where they were a year ago. The Yen has depreciated by ten percent, in line with expanded QE measures from the Ade-driven BoJ. There is an eerie calm that has set in. The USD index is sitting at 95, and experts see a possible decline to 94 as a near-term possibility, but from that support level, they also see a rebound in the making.
In line with this thinking, most currency aficionados do not see much upside for the Euro. The Pound has shown some possible improvement due to a milder perception of Brexit, but in both European scenarios, no one is forecasting a pullback in central bank accommodative measures. Economic growth has been meager, although there have been recent reasons for optimism, but inflation targets remain elusively unachieved. In his last public appearance, Mario Draghi, the head of the ECB, repeated oft-heard ECB-speak. “The downside risks to growth have dissipated,” and “The threat of deflation has been turned back”, but, even though he is now dropping hints, there was no timetable given for removing accommodation.
There also are no signs of a slackening stance toward QE programs by Japan, one specific reason that the Yen could weaken from its present value of roughly 112, to fall back to 118, a price level not seen since December of last year. The Aussie and Kiwi have both been winners of late, appreciating at roughly the same pace and doing so at slopes greater than 45 degrees. The only problem with both currencies is that each has reached historical resistance levels that have not been penetrated twice previously in the last year. Unless China goes on a growth tear or Europe and the United States step up demand demographics, neither the Aussie nor the Kiwi will find the support necessary to continue upward. Trump’s decision against TPP and to renegotiate all trade deals weighs heavy on the prospects of each currency, as well.
One financial headline of note: “Lots Of Lipstick On This Goldilocks Economy”
The author of the above headline is concerned. His rather cute metaphor was not crafted in haste. Per his narrative: “The U.S. economy is economic utopia for those who invest in risk assets. It is critical that this utopia leads to a steady improvement in the economic fundamentals that are necessary for continued expansion. This is not happening. Instead, we have seen a steady deterioration in the hard data that dictates fundamentals, but this has been glossed over by soft data and rising stock prices, serving as the proverbial lipstick on a pig.”
Economists may continue to be the optimists in the crowd, claiming that a host of favorable data points suggests that good times will continue. Several trusted recession models have not signaled a slowdown for 2017, although 2018 remains suspect. One irrefutable fact, however, is that long-term trends do not appear to be reversing any time soon. The following chart is one more clever way to demonstrate the obvious:
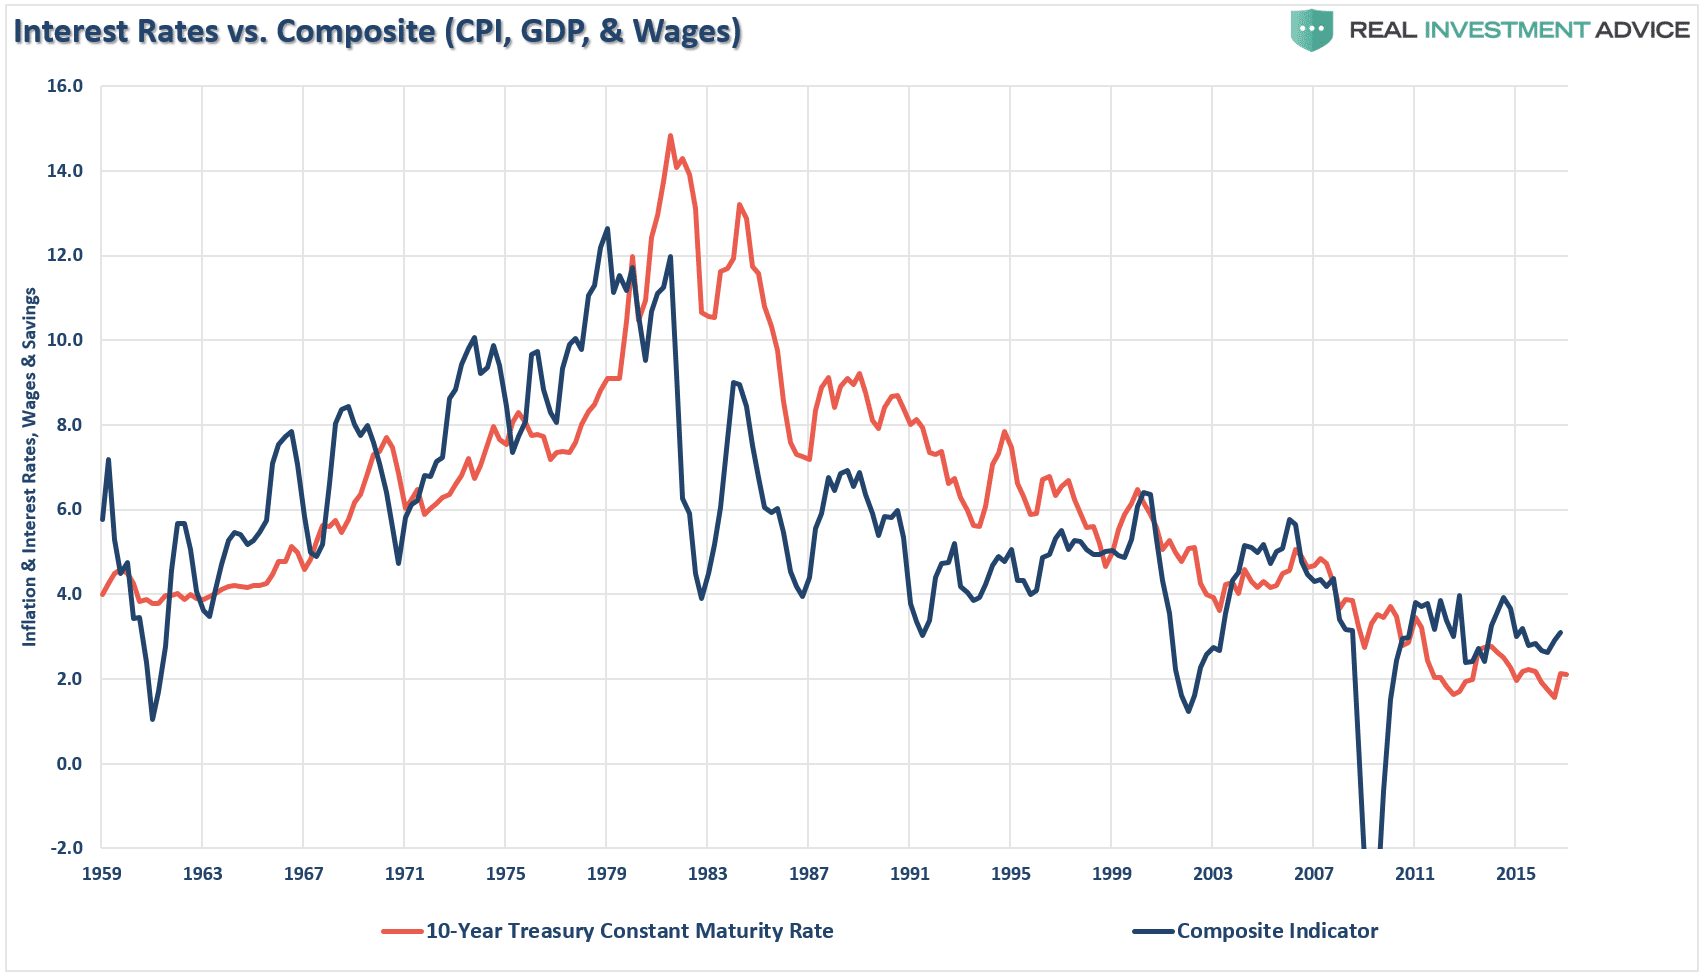
10-Year Treasury rates have been in decline for decades, as has a composite of CPI, GDP, and Wages. Interest rates may have bottomed, but an upward thrust will have disastrous ramifications. As one concerned observer noted, “Markets are entering bubble territory at the same time consumer debt, auto debt and student loan debt are out of control.” If rising rates can choke each of these areas, what about impacts on the housing industry? Real estate values took years to recover from the Great Recession, and their recovery at best has been spotty across the nation.
Concluding Remarks
Are we staring at a Goldilocks economy that is really a pig in disguise? Is it time to get real about what is staring back at us upon the near-term horizon? The analyst community is getting edgier with each passing week, and several of its members may be curtailing summer travel plans in order to be ready for a “Black Swan” event of unknown proportions. Any attempt to view the future with rose-colored glasses eventually comes back to the realization that something has got to give in the next twelve months, but what will it be and what devastation will it wrought?
The concern of the group is best summarized by the following retort: “The timing for the economy to slow down and stall couldn’t be worse. Not only are we at a point where markets are the most overextended they have ever been, but the Federal Reserve has done an incredibly poor job of managing policy over the last 10 years and has not put us into a position where we have options to effectively deal with another bust in the market.”
Stay cautious and stay prepared!
 Your capital is at risk
  Your capital is at risk