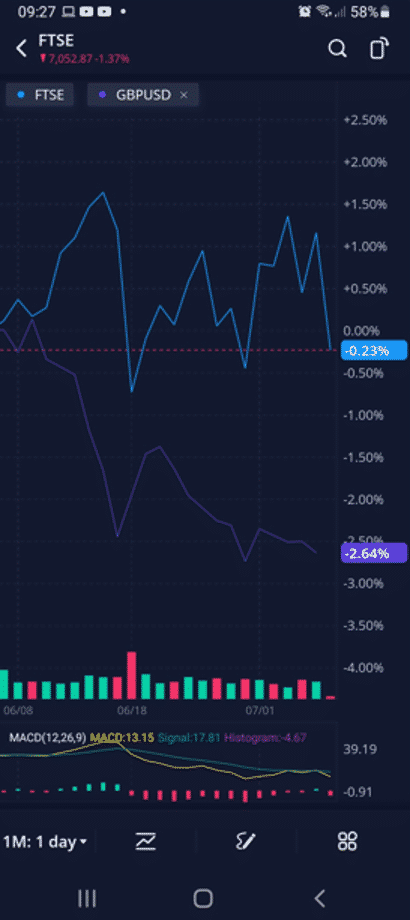
Some concerning news dripped into the markets on Wednesday as the minutes of the most recent meeting of the US Federal Reserve were dissected. Major equity indices managed to shrug off the bad news: they have been posting a succession of all-time highs over the last week and have a habit of focussing on positive news snippets. Currency markets have recognised the threat posed by the minutes and risk-on currencies have struggled as a move to USD builds momentum.
The disconnect between the two asset groups could signify that the forex market’s move will once again act as a leading indicator. No one can be certain how things will pan out, but when a similar situation happened last month, the forex move did turn out to be a good pointer to an equity price change. With the US Federal Reserve FOMC minutes revealing splits among the committee, the question is, will lightning strike twice?
Confirmation – the US Fed is Split
The minutes of June’s committee meeting were released on Wednesday. It’s easy to get bogged down in the details, but those who want to study the most important notes on the economy can do so here. They confirm the Fed’s policy decisions have reached a critical point. The best summary of the situation was offered by Stephen Stanley of Amherst Pierpont, who was speaking to Barron’s when he said:
“Imagine if the Fed could come at the asset purchase question fresh. Could the committee make a credible argument, based on what is happening in the economy right now, that the Fed should be buying assets at all, much less at a massive $120 billion per month pace? No way.”
Source: Barron’s
The Fed is trying to wriggle its way out of a situation and having to do so very publicly.
Dollar Strength and a Double-Top in GBPUSD
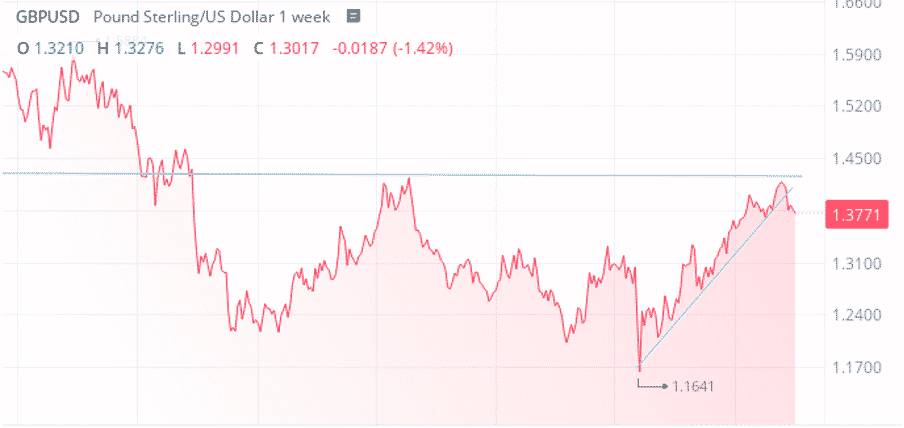
The weekly chart for GBPUSD shows sterling falling away from the 1.42 resistance point high of April 2018. A failure to break that level leads to the creation of a double-top pattern that would be ominous for GBP and a sign of sustained USD strength. There is also the break of the supporting trend line dating back to March 2020 to factor in.
GBPUSD Weekly Chart – 2017 to 2021

Source: Webull
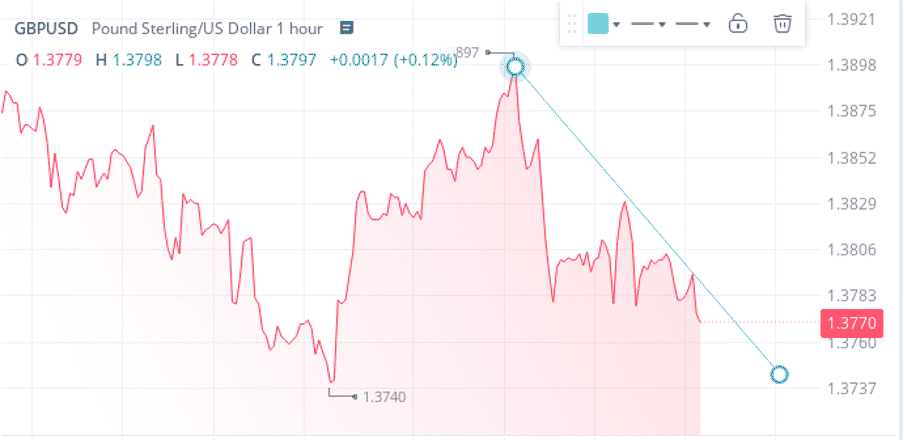
The hourly price chart shows GBPUSD price posting a significant slide over the last few days, from 1.3898 on Tuesday the 6th of July to 1.3765 at the open of European markets on Thursday. The next critical support is 1.3740, the month to date low for the currency pair.
GBPUSD Hourly Chart – 1st July – 8th July 2021
 Source: Webull
The minutes shared on Wednesday were of the meeting which took place on the 15-16th June. At that time, the briefer comments provided by Fed chair Jerome Powell in his press conference caused a two-stage price correction. The forex markets were quicker to react to the talk of tighter monetary policy and it was not until two days later that equity prices plunged. If this pattern continues, there will be plenty of traders putting the date of the next Fed meeting (27th – 28th July) in their diaries and keeping an eye on the currency markets.

Source: Webull
If you want to know more about this topic, please contact us at [email protected]
 Between 74-89% of CFD traders lose
  Your capital is at risk
  Your capital is at risk
  Your capital is at risk