The latest readings of economic vital signs for the U.S. economy were impressive, though incongruous. GDP, according to this week’s release, grew at a 3% annual clip during the third quarter, but it was difficult to reconcile with previous reports in the jobs arena, which were depressed due to hurricanes and other natural disasters. As a result, new headlines were not exactly rejoicing, as the following one indicates: “GDP Impresses On Third Quarter, But Proceed With Caution.”
The analyst community has been purporting that fear has actually been propelling our financial markets forward, but this same fear argument has a brother – the fear that charts and graphs are ominously similar to times before previous crashes. Will 2018 be the “Year of Armageddon” or will we bask in the glory of ever increasing prosperity for twelve more months? The current Bull market refuses to obey or respond to logical arguments, leading even the more creditable of business prognosticators to proclaim in rather childish tones, “Are we there yet?” Other pundits add, “Are you infuriated yet?”
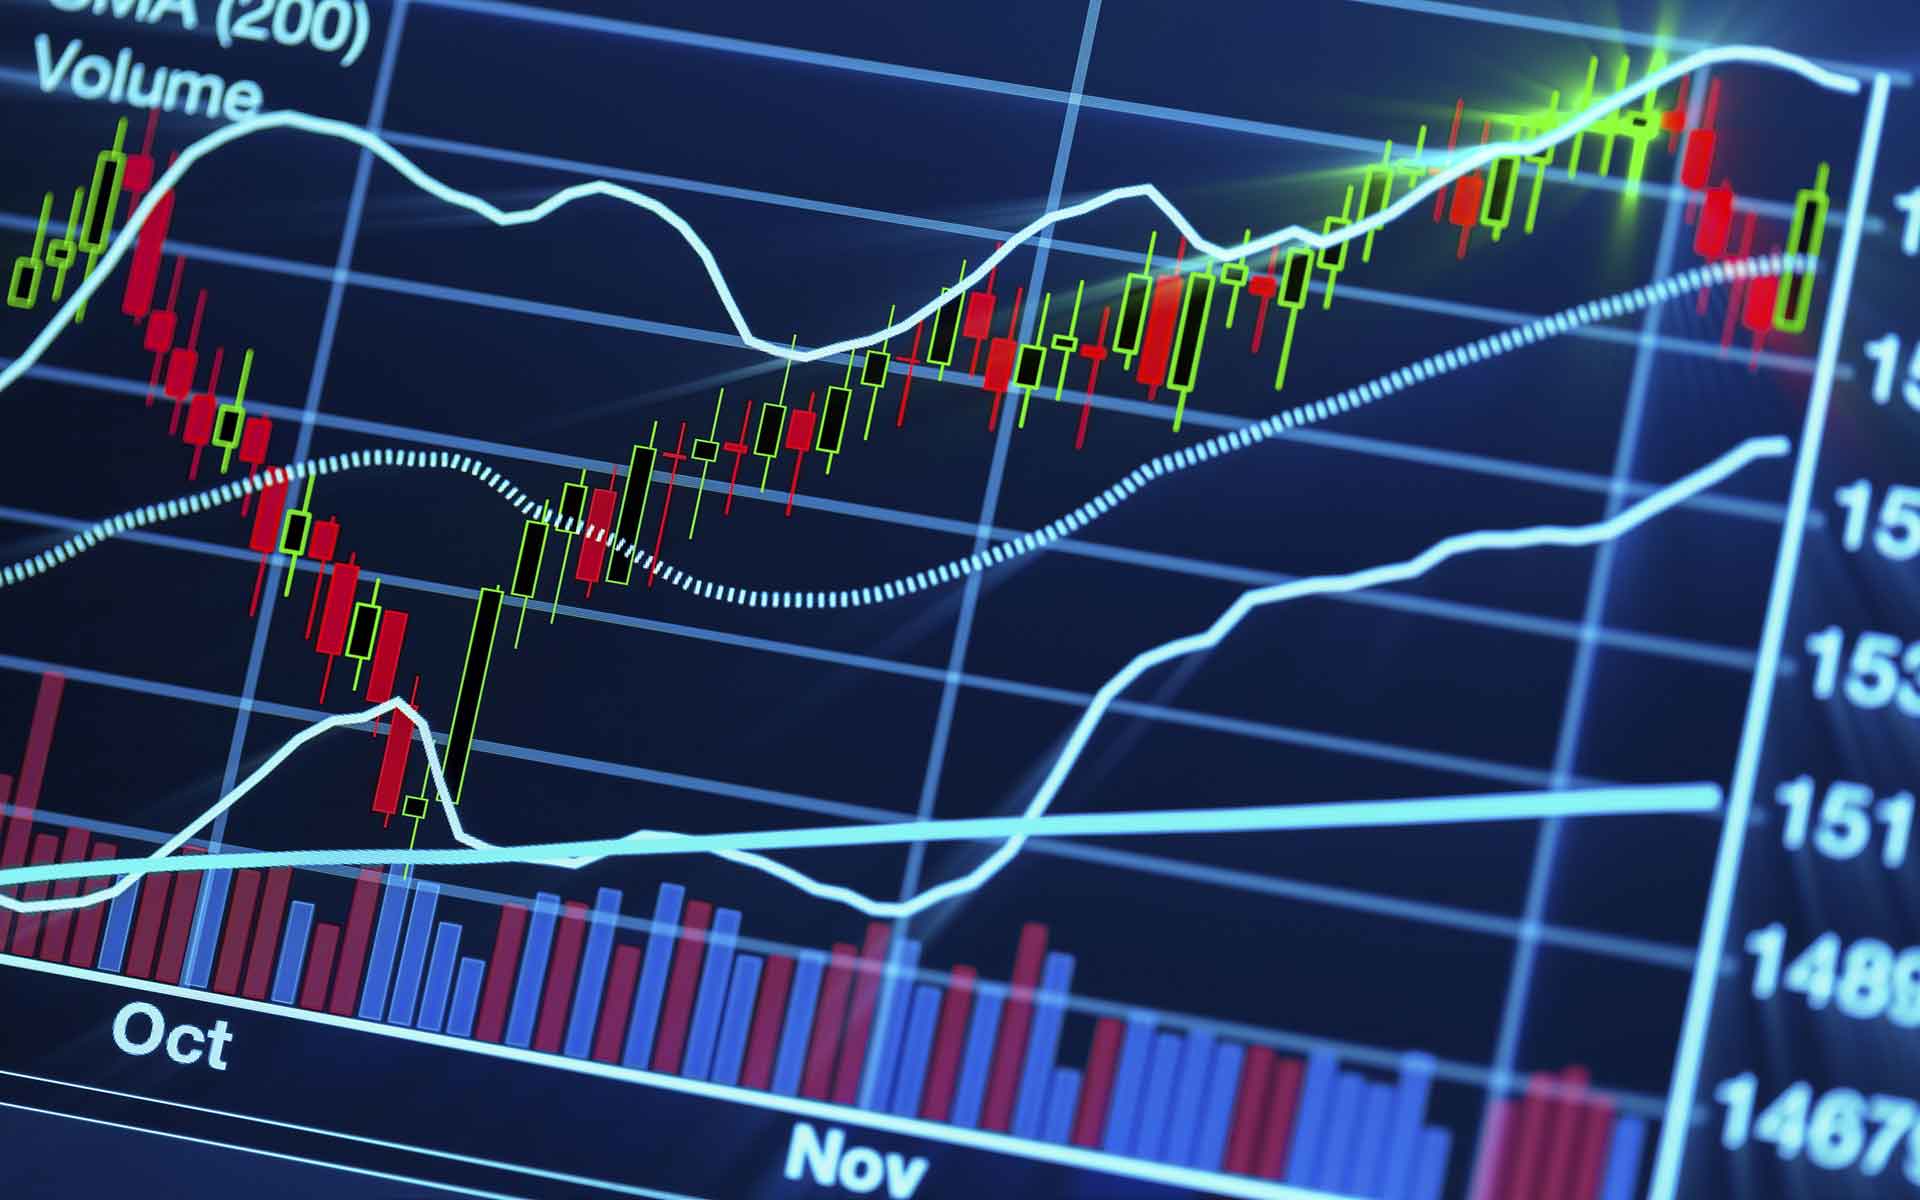
One thing is clear. No one has the slightest idea of what is next, but this simple fact does not discourage anyone from offering up their latest opinion, while surrounding it with convincing diagrams that support their general hypotheses, whether positive or negative. This preponderance of disparate reporting across the entire spectrum of possibilities does not engender confidence in future outcomes. It continually conveys the message that you had better run for cover, as if your very life depended upon it.
Read more forex news
For the moment, what were the positives of the latest GDP news release?
The reporting followed this general line: “The growth in GDP was powered by personal consumption expenditures or PCE. That was almost evenly split on healthcare, household expenses, and insurance and then goods. Investment spending was also up, indicating a more robust economy, but we are less optimistic going into 2018, largely because of consumer debt levels and what we view as an anomalous 2013 Q3 GDP data, particularly with respect to auto demand, that was powered largely by purchases of replacement vehicles from the twin hurricanes.”
Investment spending is picking up, which is a good thing, but it may have only been in anticipation of the Fed raising interest rates in the last quarter. Most narratives have been cautious when accepting a 3% figure as a building block for the future. From a longer-term perspective, no one sees the next product revolution that could power GDP growth past the 3% level and beyond. The mismatch between GDP and job growth adds to the current confusion, making the October jobs report all that much more important.
Can the current Bull market just keep on running?
The following diagram is a bit tedious, but it depicts the complete path taken by each of the dozen bulls that have run since 1950, along with our current record setter:
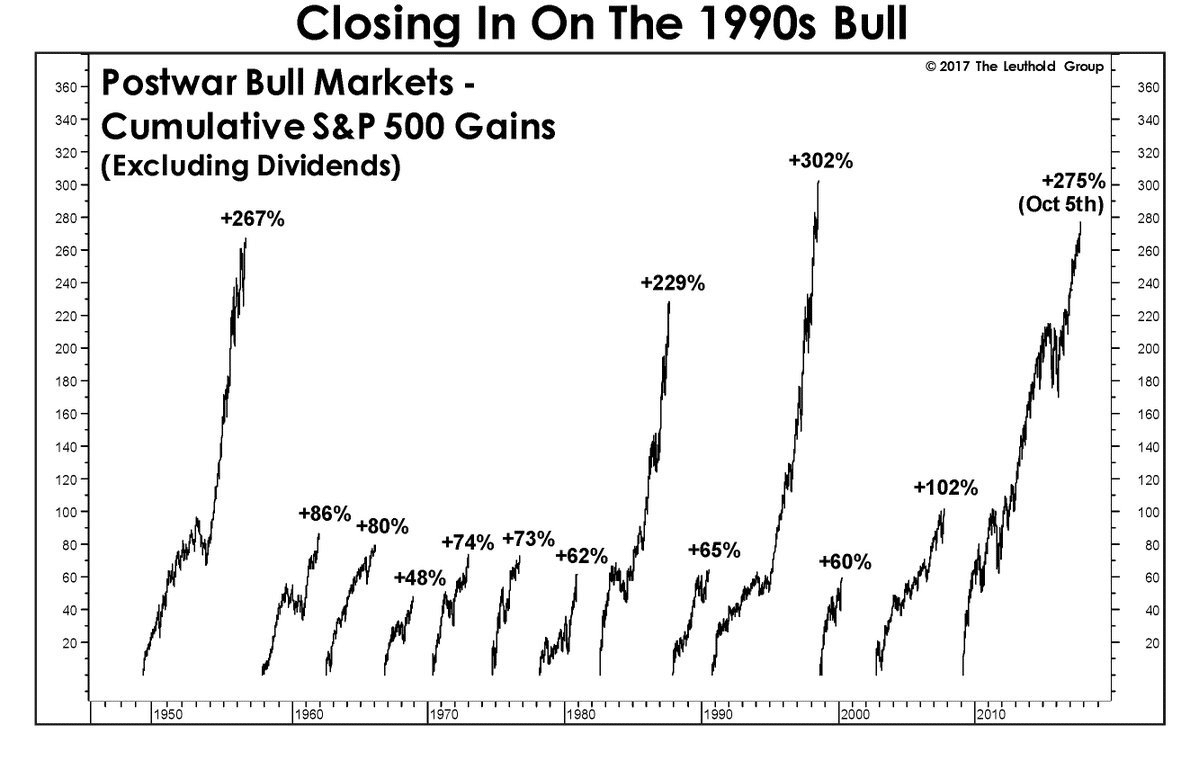
On October 5th, our ever-present Bull on a rampage actually eclipsed the “Number Two” competitor and can be seen to be closing in fast on “Number One”, the wonder of the early nineties. For traders that are a little longer in the tooth, their nightmares from 1987, some thirty years ago, are beginning to recur on a daily basis. On that infamous day in October, Monday the 19th, which has become known on Wall Street as “Black Monday”, the S&P 500 spiraled down 20.5%, the largest single-day drop in U.S. stock market history. The following chart is eerily similar to what happened three decades back:
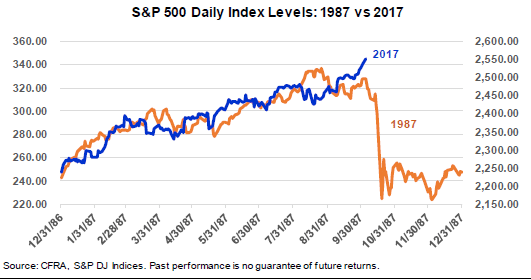
Before you run to your screens to liquidate your stock positions, be assured that there are also important differences. The Bull in the early eighties, the one on the previous chart with a “+229%” above it, had only run for sixty months. The current Bull is 103 months old, a veteran by any measure and a more gradual buildup over a longer period. The broader-based indexes that depict the sub-industries of the S&P participants are not exhibiting any state of euphoria, as in 1987, and interest rates are substantially lower than the 7% Fed rate that prevailed thirty years back.
Sam Stovall, chief investment strategist at CFRA Research, is not perturbed. As he noted in a recent interview, “When comparing the daily index levels for the S&P 500 in 1987 with the progression thus far in 2017, they appear to follow an eerily similar path. Investors understandably experience an elevation of anxiety when the current bull market is mentioned in the same breath as the 30th anniversary of the Crash of 1987. But history indicates that this comparison is not warranted.” If you are not convinced by Mr. Stovall, then, perhaps, you may want to close a few of your riskier positions.
Are financial markets really behaving like a peak is approaching?
What we have been observing from so-called market experts is that there is no reliable way of predicting when and if a market will crash. Markets do, however, display specific behavior traits that are not that difficult to ascertain. Per one market veteran: “Longtime students of the market cite a handful of conditions that typically emerge when the risk of a severe downturn is high. At an important top in the indexes:
- Key leadership sectors have usually turned to laggards;
- Credit markets have grown more hostile;
- Market volatility has been elevated for several months or more, and
- Investor sentiment frequently has gone from overconfident to suddenly fearful.”
Those that track a variety of industry sectors are not seeing a “laggard” behavior emerge. Doug Ramsey, chief investment officer at Leuthold Group, tracks such sectors as the Dow Jones Transports and the Utilities, Russell 2000, financial stocks, S&P Industrials and Materials and the equally-weighted version of the S&P 500. According to him, “At a major bull market top, we should expect to see most of these indexes lagging the Dow Jones Industrial Average and S&P 500.” Such is not the case. Each of these areas have achieved all-time highs in the past month.” A narrowing market is nowhere to be seen.
Although many experts suggest that previous debt cycle theories will not hold this time around due to broad-based central bank intervention, economists have been overly concerned with the bond markets and a perceived tightening in yield spreads. One observer, however, noted the following change: “We’re also seeing a somewhat more robust spread between the 3-month and the 10-year yield curve, something which had concerned us during the summer months, and which still concerns us so long as it hones to a mostly flat course.” The spread had shrunk from 192 to 100 basis points by early September, but has recently bounced back to 135.
Market volatility on the other hand has been subdued like never before. Average daily ranges are the tightest in a generation, and pullbacks of as little as 3% have been few and far between. One has to look back decades to find comparable examples. The VIX, the option-based accepted measure of market volatility, traditionally trends higher in anticipation of a peak, as investors get restless and start churning their positions. Investor jumpiness has not been observed, while the VIX has hovered about a value of 10, roughly one half of its long-term average level.
Lastly, investor sentiment is a trickier animal. The joke on the street is that when your taxi driver starts offering stock tips, it is time to change strategies. At present, there are no new signs of euphoria amongst the masses for getting into the market, although Charles Schwab has cited “a record pace of new-account openings.” One strategist, however, has this warning: “Our sentiment composite indexes have shown pessimism rising on small corrections. If that changes and they show optimism after a pullback, it would be a sign of a top.”
Do these observations alleviate any concerns that you might have for impending doom? The general conclusion is that investors need not be on high alert, as long as these tried and true indications of a peak are not yet present. The one caveat is that we live in extraordinary times, where central bankers have created a “tightly wound spring” of sorts with low interest rates and abundant liquidity. The existence of artificial intelligence, machine learning, algorithmic trading, momentum investing, and trend following techniques could also cause a massive “herd” reaction, the likes of which are unknown.
But then why are so many suggesting that we prepare for a crash?
The general concerns expressed by the “you-better-be-prepared-for-a-crash” crowd are best summarized in the following comments of one individual: “Complacency dominates the financial markets. Price discovery has taken a backseat to momentum and trend following. Value investors, routed for a decade, no longer provide a stabilizing presence.” This fellow is not harkening back to 1987. His memory is, perhaps, more recent by his own account. To him, it feels eerily similar to 1999 before the “dot.com” crash. In many ways, it is “déjà vu” all over again, and the inflection point is near.
Investors in their forties have witnessed three major bubbles – 1999, 2007, and now. Many so-called value-based investors are still reeling from the collapse of financial stocks during the Great Recession meltdown. From a value perspective, those stocks were a siren call that led to eventual ruin. The concern once again: “Despite the record calm on the surface of the markets, as demonstrated by historically low volatility, there is a brutal arms race going on below the surface, driving crosscurrents that are bound to create a riptide that very few expect.” The stage is set for a “flash crash” on steroids.
Concluding Remarks
Whose arguments sound the most convincing at present? In the absence of any high-alert warning signs, should we continue to invest with reckless abandon or prepare for the worst, a possible meltdown of monumental proportions? The choice is yours, but do remember that, “Complacency dominates the investment markets today as trend following and momentum trading have eviscerated value oriented investors, let alone those with a bearish bent, yet stocks and bonds are the most overpriced in history.”
In the meantime, GDP growth came in well above the 2% target value, staking a claim at 3% for all to see. The S&P 500 also extended its current record streak to seven weeks of posted gains, after a slight bobble during the week. Trump and his minions may soon pass tax-reform legislation for the wealthy. At the same time, the S&P 500 and the NASDAQ have closed above their respective Bollinger Bands, such that the coming week should be interesting.
Proceed with caution!
 Your capital is at risk
  Your capital is at risk