Divergence of central banking policies remains and will remain for some time a major driver of the economic health of the global economy. All eyes continue to focus on the Fed’s musings, as if Janet Yellen is a female version of Moses coming down from on high with the quintessential tablets that will guide our decisions for the ensuing quarter. While the analyst community goes into overdrive, more importantly, the remaining central banks across the planet follow in lockstep as best they can. Timing, however, is the issue. For example, the ECB in Europe and the BoJ in Japan have mimicked the Fed’s every action, but each lags roughly three years behind the leader’s footsteps.
When the Fed telegraphs a change in policy direction, as it did at its last meeting, then one can easily speculate that others will follow like lemmings somewhere down the road. Financial headlines were quick to point out that the Fed once again raised its benchmark rate range as expected and communicated that perhaps one more hike might be in the offing before the end of the year. The lead story, however, may have been buried in the story that followed, which many would have missed, if they tuned out after the rate announcement. The real news was that Fed governors were determined to reduce its bloated balance sheet over time, another twist on the “normalization” theme.
How bloated is the Fed’s balance sheet, you ask? Try swallowing a $4.3 trillion portfolio of bonds and other assets. What was it before Bernanke went on a tear to shore up liquidity following the last financial crisis? November 2008 was the official start of “QE1”, as it has come to be known. Prior to the financial crisis, the Fed’s balance sheet held approximately $700 billion of Treasury notes, a mere 16.2% of today’s total. And now the Fed wants to liquidate its holdings? What will be the impact of those actions? Hmmm…
Read more financial and forex news
What is the relationship between Fed holdings and equity prices?
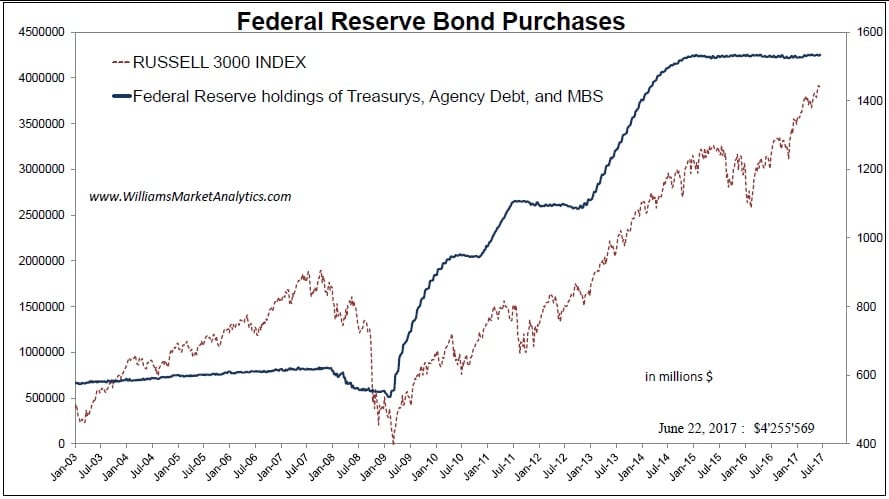
You do not have to be a rocket scientist to interpret what is going on in the above diagram. Fed actions pumped an avalanche of liquidity into the system, whether it be from QE1, QE2, or QE3. The Fed also chose to direct its flow of “easy money” through its banking brethren, rather than directly to consumers. Main Street was therefore not the beneficiary, but the effect on equity prices was dramatic. When quantitative easing went into reverse and leveled out in 2014, stock appreciation came to an abrupt halt. The decline continued, until the “Trump Trade” bolstered investor confidence in late 2016. A new buying spree turned prices north once again, but momentum has recently deteriorated.
If the “Great Monetary Policy Experiment” had delivered measurable and expected economic results, as had been originally promised, then a party would have ensued and we would be discussing how prosperity had spread to every nook and cranny across the globe. Such was not the case. The economic recovery in the U.S. has been long and slow, although admittedly the second longest Bull market in recorded history. GDP growth from 2009 to 2017 has only averaged a paltry 1.9% on an annualized basis, while growth rates for 2002/2007 and 1992/2000 expansions delivered 3.1% and 3.9%, respectively. Unemployment also declined at a much slower pace, and hyperinflation, the dreaded boogeyman in the plan, never reached its head above 2%, despite a swelling money supply that swamped the nation.
How did we get here and is it really all that bad?
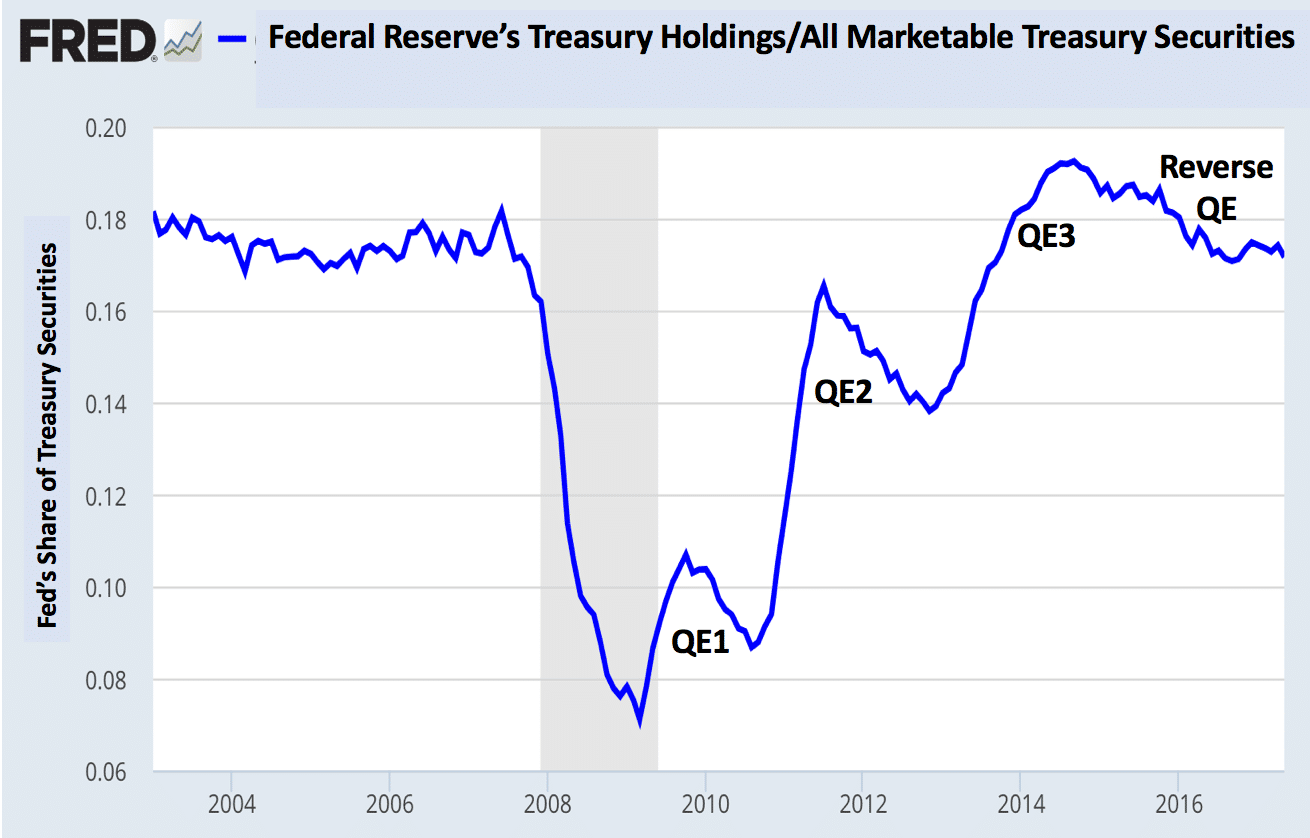
If we peruse the chart presented above, it appears that the Fed is right on target, with respect to its Treasury holdings and share of market, even after multiple easing programs have done their respective damage. The issue, however, is not so much related to Treasuries, as it is with the other assets that have swelled the balance sheet to its current bloated state. Here is one analyst’s recap of how we got to this point:
- “In November 2008, the Fed began buying $600 billion in mortgage-backed securities (QE 1);
- In November 2010, the Fed announced a second round of quantitative easing (QE 2), buying $600 billion in U.S. Treasuries through the second quarter of 2011;
- Finally, a third round of quantitative easing was announced in September 2012 during which the Fed committed to buy $40 billion (and later up to $85 billion) of bonds per month on an open-ended basis (“QE forever”); and
- Purchases were finally halted in October 2014 after the central bank had accumulated $4.5 trillion in assets.”
To its credit, from October the Fed has halted its buying spree and recorded a small, but notable reduction down to $4.3 trillion. At its recent June meeting, it announced its plan to make greater inroads over time, as long as the economy and other matters (i.e., Trump, Brexit, and geopolitical machinations) permitted. We have heard these same words when it came to potential interest rate hikes. There seem to be two “normalization” tracks that must be accommodated in the days ahead.
The U.S., however, is not an island in the global economy, nor is it immune from what may transpire across the Atlantic or Pacific Oceans. The ECB and BoJ have bloated balance sheets, as well. If we had posted similar charts for each of these entities, as we did earlier for the Fed, the gradually sloping 45 degree angle would be present in each, with current values topping out at $3.8 and $4.5 trillion, respectively for the ECB and BoJ. The only problem is that there was no leveling out at the end of 2014. Each has maintained a positive slope and shows no sign of abatement. In other words, these other two major central banking partners are three years behind our current position.
What did the Fed announce as its balance sheet normalization process?
If you read past the hoopla about interest rate hikes and the potential for further tightening during 2017, then you would have seen the following: “The FOMC released a surprisingly detailed plan of how it will unwind its balance sheet later this year. Fed chair Janet Yellen also said during the press conference these plans could be “put in effect relatively soon” if the data come in as expected. The announcement today can be seen as part of the FOMC’s ongoing efforts to get the markets ready for the shrinking of its balance sheet.”
The actual details of the Fed’s plan were as follows:
- “The Fed’s plan would start reducing the holdings by allowing a small amount of net maturities per month — $6 billion in Treasury securities and $4 billion in mortgage bonds — and to allow that amount to rise each quarter; and
- Those limits would ultimately rise to a maximum of $30 billion a month for Treasuries and $20 billion a month for mortgage securities.”
Suddenly, analysts were confronted with the possibility of a new “driver” that could overly influence the prevailing narrative for the remainder of the year. Forget Trump, Congress, and the plausibility of a “soft” Brexit. The concept of “easy money” was at peril, and no one is quite sure what that means going forward.
Is there a “Black Hole” or are we getting overly concerned about nothing?
One aspiring physicist amongst the analyst ranks chose to express his views by employing terms reminiscent of Einstein’s relativity revelations: “Ben Bernanke inspired QE3 that created a black hole in the economic space-time continuum that has an event horizon and a financial singularity therein that is related to easy-money. Easy-money debases fiat currencies, finances inefficient and non-productive activities, and destroys wealth. The destructive power of easy-money is being used to financially engineer an inexorable paradigm shift to an automated planned economy.”
Perhaps, a simpler scientific concept would prove more convincing: For every action, there is an equal and opposite reaction. Newton does trump Einstein when it comes to simplicity, but the above analyst is concerned that all forms of QE have been abject failures when it came to delivering economic results. From his perspective, however, these programs did create “black holes” that sucked easy-money into non-productive areas of the economy. When market forces are held at bay, capital flows can become disjointed, resulting in inefficient resource allocations that can be detrimental over the long term by stimulating more demand for easy-money handouts.
Is there an opposing viewpoint? The chart below offers up another opinion:
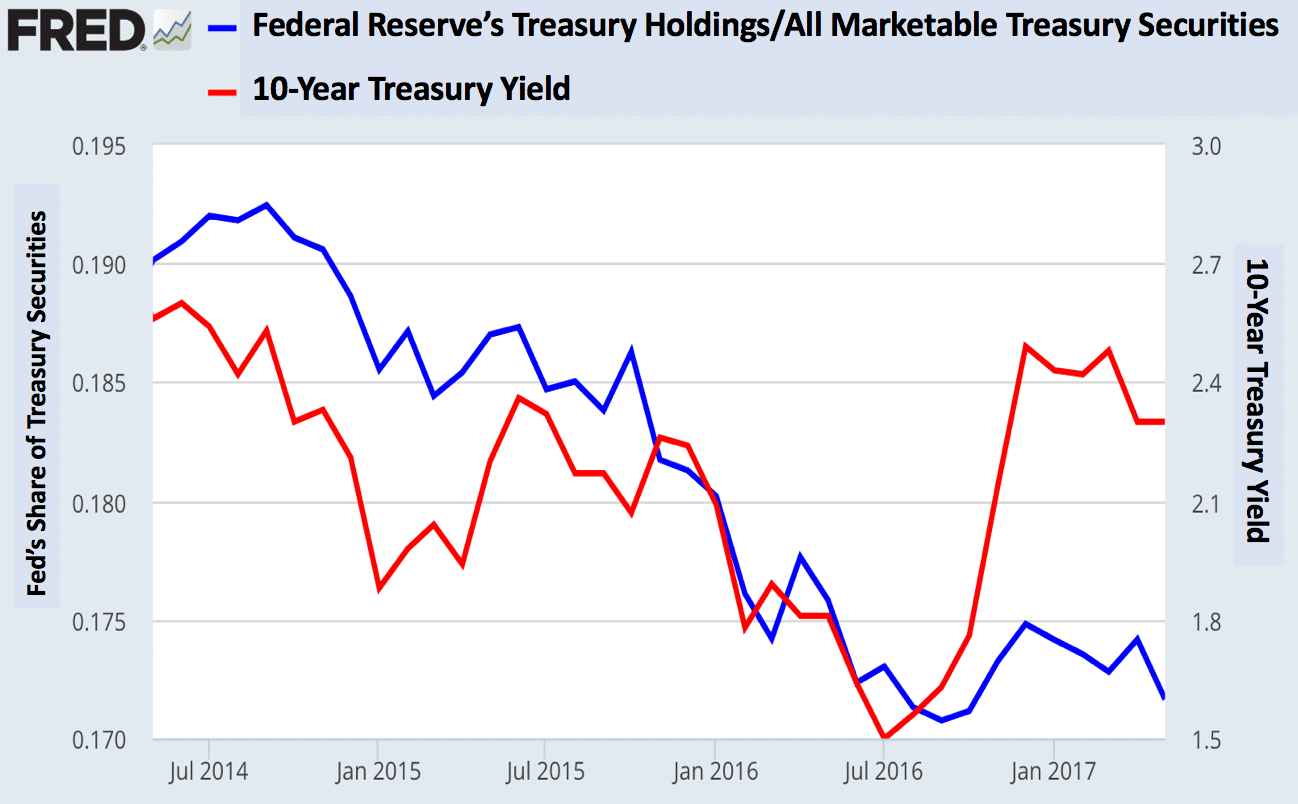
If you expand upon the “Reverse QE” portion of the previous chart and correlate balance sheet reductions to market yields, you arrive at the above “disconnect”. The author of an opposing argument suggests that, “The Fed has been effectively shrinking its balance sheet for several years now, and it has been much ado about nothing. Whatever influence QE had, it seems to be dwarfed by other economic forces driving long-term treasury yields.”
The above author goes on to add that a “Taper Tantrum” did not follow Yellen’s balance sheet normalization announcement, further evidence that the market could care less. The Fed, however, has not been dumping securities on the market. New debt issuances have reduced apparent share valuations. If other forces are driving interest rates north, could they be the “equal and opposite reactions” that are warping space-time?
Concluding Remarks
In some regards, the Fed has thrown a curveball into the mix and sent analysts back to their drawing boards to evaluate what might come and how to adjust the economic narrative that had been firmly in place. Per one analyst: “It’s nice to hear Bull’s talk about their great long equity positions being backed by strong company earnings and good economic fundamentals. However, if the above three central banks (Fed, ECB, and BoJ) were to reduce their asset holdings by, say 10%-15%, we’ll see just how strong company earnings and the economy really are as share prices tumble.”
In some regards, we are currently in the eye of the storm, regaling in the calmness of the moment, or worse yet, standing near the event horizon of an economic black hole that could suck the life out of any currency or economic system on the planet. Once again, the words of the above analyst cause a pause for thought: “We are living in a surrealistic world where the “authorities” are overseeing the creation of potentially the greatest asset bubble of all time. Unless confronted by accelerating real-world inflation or political pressure, central banks have no incentive to significantly reduce their balance sheets. The madness continues.”
Stay cautious, and be prepared for any outcome!
 Your capital is at risk
  Your capital is at risk