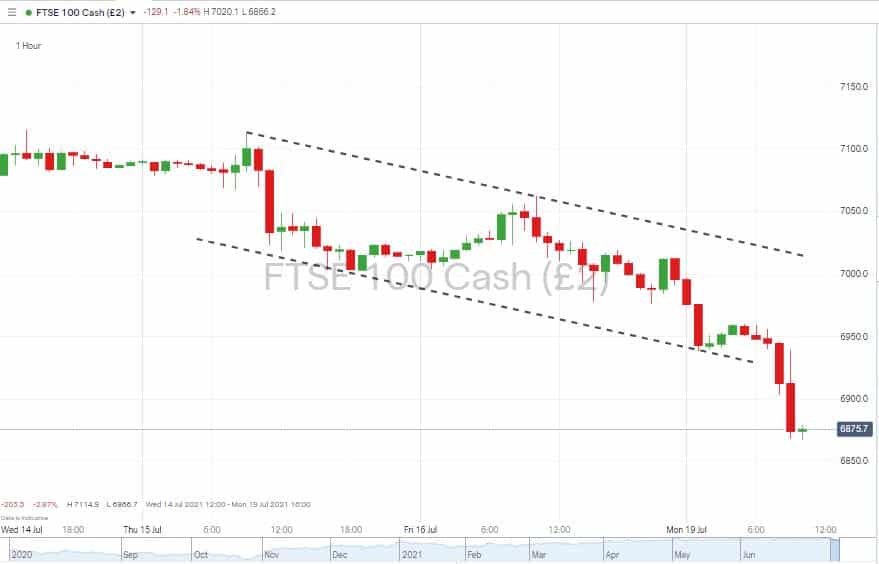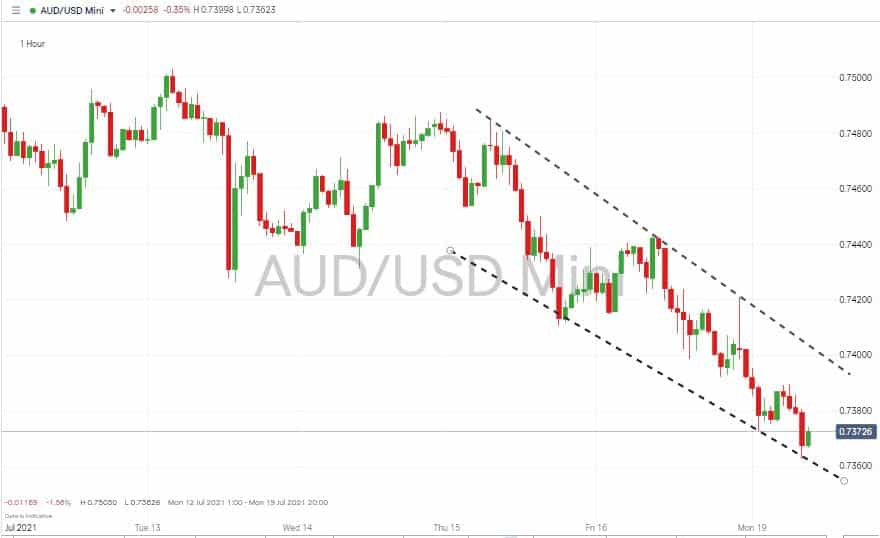
The start of the trading week has seen risk taken off the table across the board. The move, which started on Friday, followed the release of alarming figures from the University of Michigan survey of US Consumer Sentiment that indicated consumers think prices will jump by 4.8% over the next year. Asian markets and the European open followed the lead; down on Monday, they generated price charts that can only be described as bearish.
Risk off in Equities – FTSE 100 1Hr price chart

Source: IG
Risk off in Forex – AUDUSD 1Hr price chart

Source: IG
The added caution which came into the markets last week left major equity indices posting their first down-week for a month. That will cause many to ask the question, is this a dip to buy or the start of a wider and deeper correction?
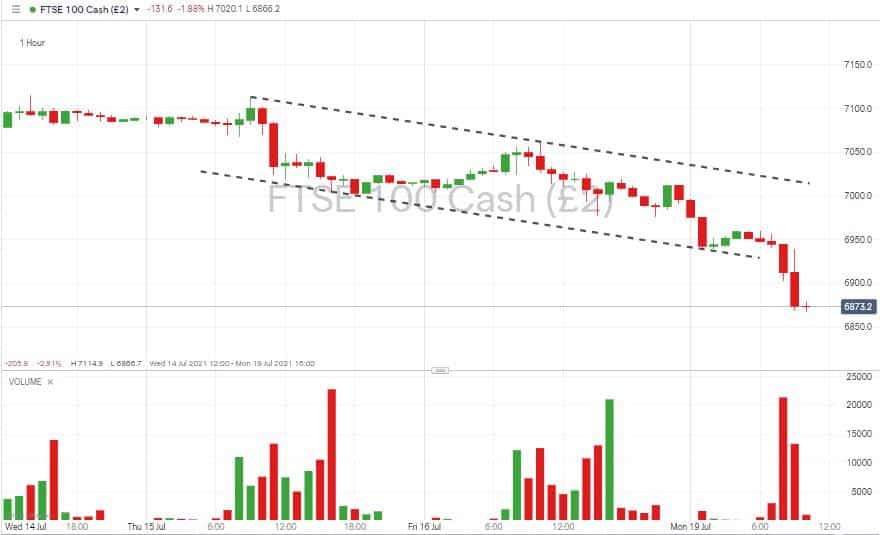
If events of the first half of the year are anything to go by, then stepping in at current levels could pay off, but there are some signs from trading volumes that the downward move is not quite over. The first trading hour of the London session posted increased trading volumes. Activity is far higher than during any of the last four day’s opening hours. The flow through the market is matched only by the volume levels seen at the London market close when the US markets are also operating, so they are typically busier. The fact that the associated hourly is a big red one, which breached the supporting trend line, suggests the sell-off might not yet be over.
Risk off in Equities – FTSE 100 1Hr price chart with Trading Volumes

Source: IG
It is possible that the 8 am – 9 am trading activity in the FTSE 100 represents a ‘capitulation candle’, a final downward move that clears out all the stop-losses before price recovers. But a check of the broader markets points to the sell-off gaining momentum. Between the 12th and the 19th of July, only gold, traditionally seen as a haven, increased in price. Risk-on forex, silver, crude oil and cryptos all reported investors taking their money and putting it back in their pockets.
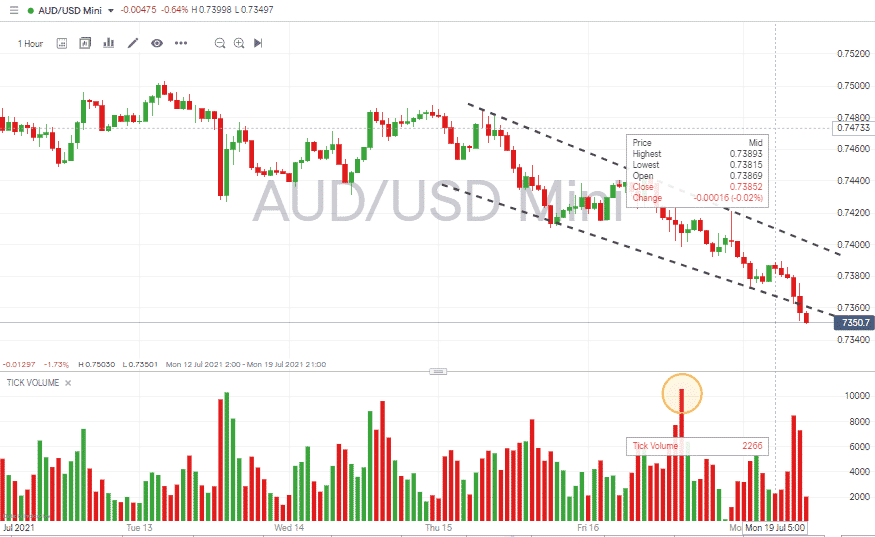
In the forex markets, trading volume has picked up during the sell-off. However, an interesting discrepancy is that in the AUDUSD currency pair, volumes peaked on Friday afternoon. Monday morning’s red candles can’t be dismissed, but the most recent selling has less momentum than is being seen in the equity markets.
Risk off in Forex – AUDUSD 1Hr price chart – with Trading Volumes

Source: IG
Asset Markets Weekly Price Change
Instrument | 12th July | 19th July | Hourly | Daily | % Change |
GBP/USD | 1.3887 | 1.3714 | Strong Sell | Strong Sell | -1.25% |
EUR/USD | 1.1866 | 1.1781 | Strong Sell | Strong Sell | -0.72% |
FTSE 100 | 7,093 | 6,913 | Strong Sell | Strong Sell | -2.54% |
S&P 500 | 4,360 | 4,305 | Strong Sell | Strong Buy | -1.26% |
Gold | 1,801 | 1,806 | Strong Sell | Neutral | 0.28% |
Silver | 2,593 | 2,538 | Strong Sell | Strong Sell | -2.12% |
Crude Oil WTI | 73.74 | 69.99 | Strong Sell | Strong Sell | -5.09% |
Bitcoin | 34,232 | 31,575 | Neutral | Sell | -7.76% |
Source: Forex Traders Technical Analysis
If you want to know more about this topic, please contact us at [email protected]
 Between 74-89% of CFD traders lose
  Your capital is at risk
  Your capital is at risk
  Your capital is at risk