Bobby Fischer, the American chess Grandmaster that defeated the Russians at their own game, but passed away in 2008, must be turning in his grave. Oil ministers from Russia, Saudi Arabia, and Iran are currently embroiled in a global chess match of epic proportions, yet the economic giants of the West are strolling the sidelines, mere pawns in a struggle that refuses to head to an endgame. As a result, oil prices continue to gyrate wildly as each move unfolds, followed by gasps from harried onlookers in the investment community. Bobby? Where are you? We need your expertise, and Pronto!
Articles about oil dominate the financial pages across the web. Never-before-heard-of experts and gurus appear daily, each presenting a wealth of analyses and charts that demonstrate their insider knowledge, but fail to convince anyone about what might transpire next week, next month, or even a year away. At this point, more speculation on future outcomes is not necessary. We have heard every argument known to mankind, but prices continue to bounce between tight ranges, inventories have filled nearly every storage facility to capacity, yet production just keeps building, and the supply glut swells.
What goes down must surely come up at some point, but “when” is the burning question. No analyst worth his salt is recommending a long position in oil futures at this time. A few highly respected hedge fund managers that have made fortunes on oil price speculation in the past have been chided of late for the millions in losses that they have accumulated while betting on a short squeeze that refuses to happen. Predicting reversals is always a risky proposition, one that most traders learn to avoid like the plague early in their careers, but the contrarian’s bet often offers up the greatest chance for gain. Betting on a commodity currency, like the Loonie, is still the better way to go.
What are the current EIA projections for oil production and consumption?
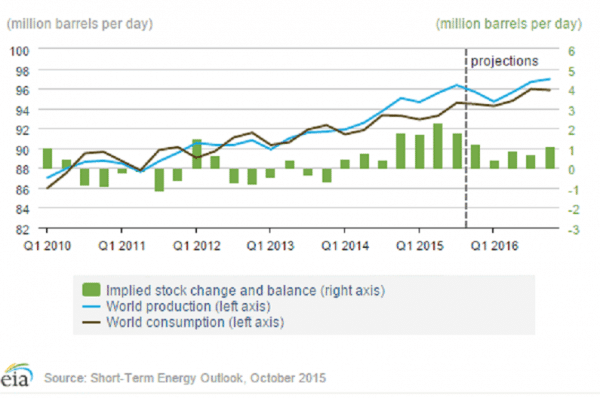
The energy oversight organization, the International Energy Agency (EIA), has tried to put an optimistic spin on the future oil situation by predicting that the so-called supply glut will dissipate slowly over the current year. According to the above chart, oil inventories, depicted by the green bars, have already peaked, and global consumption should once again catch up with production in the near term. Have market participants jumped on this bandwagon and adjusted accordingly? Unfortunately, these predictions do not mirror the current reality.
If you believe the chart, then you would expect production to have peaked in late 2015 and begun declining at the start of 2016. Recently published data does not support this forecast. Saudi Arabia, the number one producer, and Russia at number two have neither cut back. In fact, both are pumping at their alleged peak volumes. Add in Iran, where sanctions have fallen by the wayside, and OPEC, along with Russia, refuses to cut back. Their goal, as has been stated openly on many occasions, is to drive shale and tar sand producers out of business, at least for the short run, thereby securing greater market share and the ability to raise future prices. Oil rig counts in the U.S. have dropped by 60%, but production just keeps pumping right along.
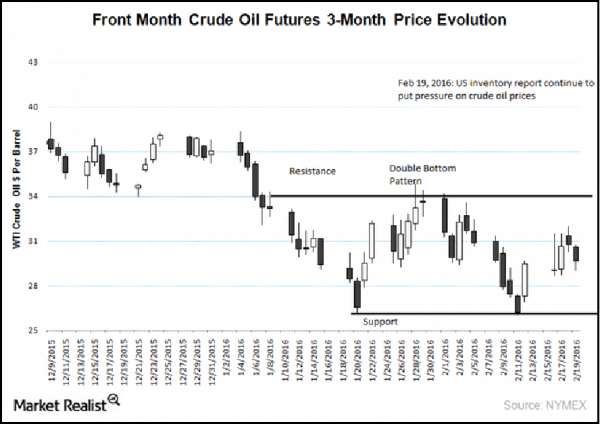
As a result, oil prices have been range bound for the past several weeks. The market cannot seem to break either support or resistance, as illustrated in the chart below:
On average, OPEC members are still making money on the margin with $30/barrel oil, but shale and tar sand producers are having a harder time where their average cost hovers around $45 to $50. Warnings of industry bankruptcies have been prevalent, as many investors jumped into this new market while cheap bank loans, unwarranted from a purely cost/benefit analysis, were easy to come by. Normal market forces have not prevailed as Zero-Interest Rate Policies (ZIRP) created one more over-inflated bubble.
What actions in the marketplace are causing these sudden price gyrations?
The energy market is often called the “Mother of all markets”, since it is by far the largest market in the global economy. One would think that supply and demand forces would rule the road, but, unfortunately, its major component, oil, is enmeshed in political intrigue, carried out by an active cabal behind the scenes. OPEC members rule by whim, even when there appears to be general consent, if not total agreement, on the strategy at hand. Cost dynamics vary. National economies are funded in differing ways. The Saudis have massive cash reserves, while poorer nations depend on oil to fund their government budgets and draw investment capital to their cause.
Low prices are putting strains on everyone. Experts liken the moves in the shadows to be more like a chess match than outright confrontations. Saudi Arabia and Iran despise one another on religious grounds, but if production quotas are to be moderated, there needs to be a facilitator. In a recent development, Russia, a non-member of OPEC, has assumed that role. Russia is aligned with Iran and Syria, due to large weapon sales to each, and was able to broker an agreement between Saudi Arabia, Qatar, and Venezuela to freeze production levels in an effort to prop up oil prices and restore a level of confidence in the market.
Oil prices suddenly “gapped up” in the market, as per the chart, but this euphoria was short lived. While the four producers had agreed to freeze at January levels, their deal would only continue if others joined in on the fun. After making two steps forward, the market quickly reversed when headlines read, “Oil prices fell as much as 5 percent on Tuesday after Saudi Oil Minister Ali Al-Naimi ruled out any production cuts, restating the kingdom’s rationale for maintaining output was that demand would pick up excess crude that has crushed prices over the past 20 months.” It also did not help when Iran’s oil minister described the purported freeze as “laughable”. And so, the beat goes on.
How are other markets reacting to the ongoing drama in the oil fields?
Comments from analysts were decidedly pessimistic. Two quotes from the analyst community read, “If they freeze production at January levels, when you’re already over supplied by around a million barrels per day, it just prolongs that situation of oversupply,” and, “Without concrete actions to cut production, we remain highly skeptical that prices could be moving higher.” What else is new?
Stock market analysts, however, are confused and perplexed. If 2015 was the year that central bankers distorted market forces and manipulated pricing activity, then 2016 was quickly shaping up to be the year that oil ministers grabbed the baton and began overly influencing market forces in unpredictable ways. Age-old correlations between stocks and oil prices were suddenly being thrown out the window. Historically, lower commodity prices meant that businesses would have higher earnings and consumers would spend more, two good things that would typically boost stock prices significantly.
Oil and stock prices, however, have lately been dancing a tango together. If one is up, the other follows, too, and conversely, as well. Per one befuddled observer, “A lot of folks are scratching their heads about the recent high correlation between stocks and oil, and it has inspired some high profile musing. Ben Bernanke posits that both stocks and oil are reacting to slowing global growth. Howard Marks recently told my Bloomberg colleagues on television that any correlation between stocks and oil is proof that investors simply don’t understand the relationship between the two.”
Stock management firms, as a result, are reassessing risk diversification models that depend on specific correlations holding up when conditions radically shift. No one now believes that basic correlations are forever stable, especially when markets are under stress. The fact is that we are living in unusual times when market forces have been constrained due to ZIRP, capital allocations have not been market driven, and attempts to manipulate major commodity markets have gone awry.
Foreign exchange markets offer more stable pricing correlations
The energy market may be the largest from an economic perspective, but no trading market comes close to the forex market, which tops out at over $5 trillion a day in turnover. Size matters here, and age-old correlations do not break down when volatility raises its fortuitous head, especially for commodity-based currencies. When it comes to oil, look no further than the Canadian Dollar. The Loonie, or more precisely, the “USD/CAD” currency pair, continues to offer many fine opportunities for gain, especially when a prudent level of leverage is applied to the undertaking.
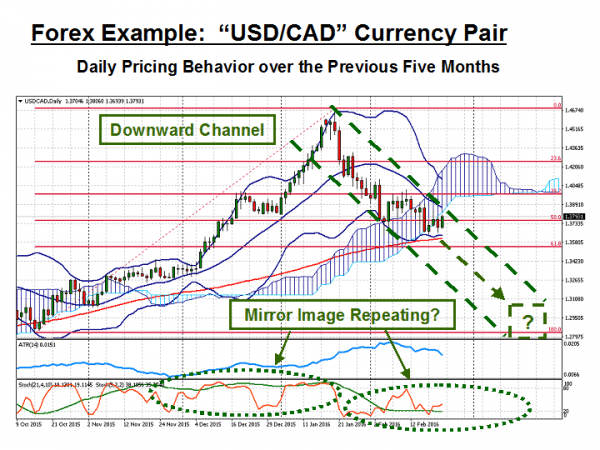
It has been three long years since the Loonie and the greenback were on par with one another. If you had been a wise forex trader and shorted the “CAD” long term, then your fortunes would have already been legendary. Parity was commonplace from 2011 through 2013 when prices for crude hovered around $100 per barrel. Oil rests at $32 today, but there is plenty of room to go, if parity is ever to be seen again. In the meantime, volatility is high, a good thing for traders. Pull out your best range-trading strategies and be prepared to jump on the downtrend when it materializes. It should be a fun ride, worthy of any trader’s consideration, if the channel plays out and the mirror image in the Stochastics repeats.
“So goes oil, so goes the Loonie” may be a time-honored correlation that has benefited many traders in the past, but the ride on this train will not always be a smooth one. The Canadian economy has been weak of late, and the word on the street is that the Bank of Canada will soon be favoring an interest rate cut. Forecasts of GDP growth in 2016 have been slashed from 2.0% to 1.4%, and budget deficits are increasing more quickly, as well, due to falling oil prices. The current odds for a rate cut in March are placed at 20%, but the less than rosy economic picture in Canada may move that figure upward.
Concluding Remarks
As spring approaches, the potential for political strife in the Middle East is a near certainty, and with it, more volatility and drama in the oil sector of the global economy. Price swings in oil may be too erratic for prudent trading strategies, but price volatility is tempered to a degree in the forex market. The Loonie presently hovers around $1.37, but analysts are targeting the $1.31 region. It might be a bit bumpy, but timing is favorable. Plan your moves, and trade with caution.
Read more forex news
 Your capital is at risk
  Your capital is at risk