
What does gold’s inaction tell us about the market tailspin? Monday the 2nd of November
Part of gold’s allure is that in chemical terms it is an inert metal. Its reluctance to react in the lab has now carried over into the financial markets. As other asset groups have fallen by more than 10%, the price of gold has held steady for several weeks.
Gold’s sideways trading offers up some clues to price moves in other assets
Since the middle of October, the weekly closing price of gold has been within a price range of 30 cents.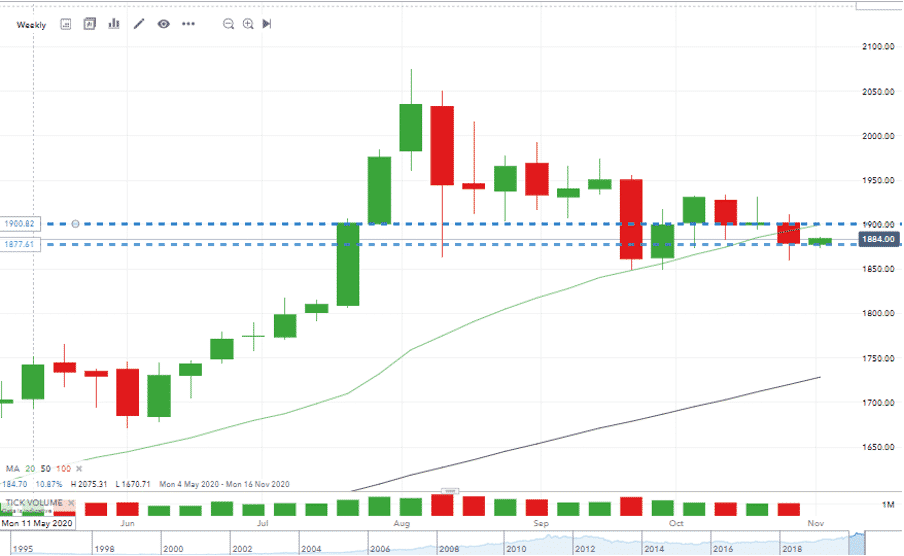
Source: IG
It may, or may not, be a time to buy the metal. The price consolidation may reflect a building momentum to a breakout. The low volatility in the market can offer an insight into the potential for buying into other assets.
The March sell-off in the broader markets also saw gold fall in price by 14.64% in the six days following the 9th of March. The strong selling pressure went against the traditionally held view that gold is a defensive asset, one that is likely to increase in value while others around it slump. At the time, this contrarian price move was explained as being traders liquidating positions in the metal to meet margin calls on other parts of their book.
While gold continues to trade within the price range of $1860 – $1933; there could be scope for those looking to buy dips.
Gold’s Support and Resistance Levels are:
- S1 1836
- S2 1803
- S3 1763
- R1 1909
- R2 1932
- R3 1989
The 1932 (four-weekly high) and Resistance 2 level of 1932 will be likely to provide a stern test of any upward move, so a close above those levels would be very bullish for the metal.
What sectors is the sell-off impacting?
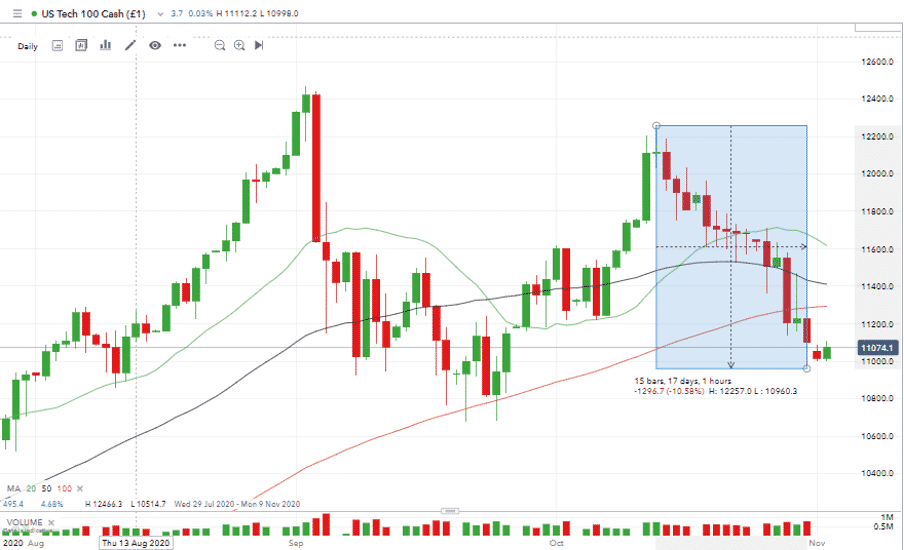
The fall from recent highs has been more significant in tech-stocks than in the broader economy. From the 13th to the 30th of October the Nasdaq 100 is down 10.58% with the S&P 500 index posting a fall of 8.92% over the same period.
That is significant because, in the March equity crash, the tech sector held up better than the broader market. Not only is the relative performance of the indices different, but the Nasdaq fall can now be recorded as a technical correction (downwards move over 10%). Market analyst Ed Yardeni, head of Yardeni Research, suggests that it gives the tech sector a chance to bounce and that the tech sell-off could almost be done and dusted. He stated:
“I don’t expect more than a garden variety correction, which would be a 10-15% drop.”
Source: CNBC
Sell-offs can be measured in time as well as price. The daily candle chart for Nasdaq100 now shows 11 out of 14 days posting price falls. The RSI is now approaching 30 on a daily scale. Another factor which will interest those looking to go long is that trading volumes have not increased to an amount to suggest the selling pressure was panic-driven.
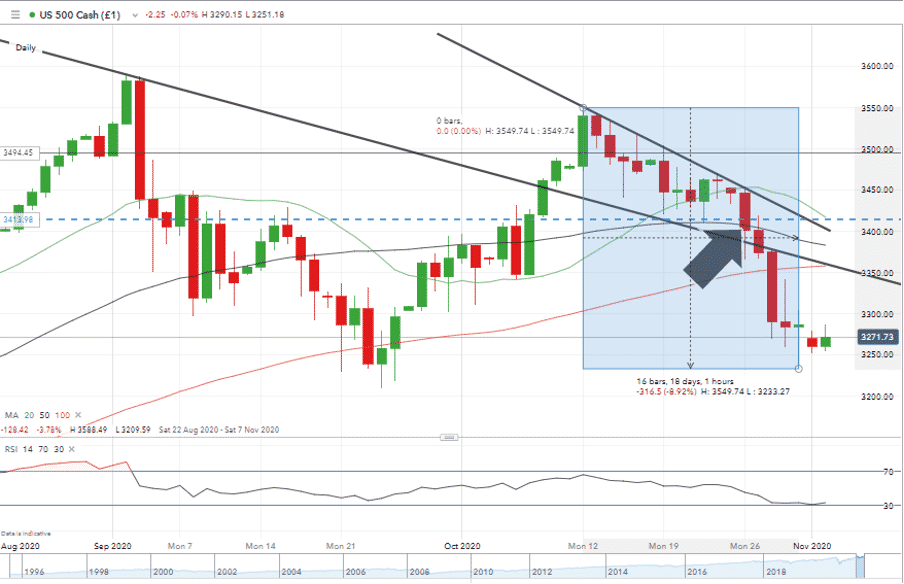
Source: IG
Before Monday’s European open the mood was still bearish and the risks associated with dip-buying are very real. But some will be taking the view that the sell-off represents profit-taking in tech stocks which had been overbought in the short-term but are still ultimately the best place to invest.
Our analysis is based on a comprehensive summary of market data. We use a range of metrics with weighting given to simple and exponential moving averages and key technical indicators.Any information contained on this Website is provided as general market information for educational and entertainment purposes only, and does not constitute investment advice. The Website should not be relied upon as a substitute for extensive independent market research before making your actual trading decisions. Opinions, market data, recommendations or any other content is subject to change at any time without notice. ForexTraders will not accept liability for any loss or damage, including without limitation any loss of profit, which may arise directly or indirectly from use of or reliance on such information.
PAST PERFORMANCE IS NOT NECESSARILY INDICATIVE OF FUTURE RESULTS.
 Your capital is at risk
  Your capital is at risk