
Monday and Tuesday of this week are quiet in terms of news releases, but the lack of high-impact announcements hasn’t prevented risk appetite among investors from flip-flopping. A weak start to Monday’s session was followed by a show of strength from the bulls and an overnight ambush by the bears. There appears to be little consensus about how the market should perceive risk, or possibly even what the risks are. October’s markets so far definitely favour range traders and those with intraday trend strategies.
S&P 500 Index – Daily Price Chart – Price in the Middle of the Downward Trend

Source: IG
Equities Trading in the Middle of a Downward Channel
Soon after the open on Tuesday, global stock indices were again showing strength but are far from confirming a breakout. Sitting in the middle of the recently formed daily price chart downwards channel there are equally convincing arguments for price rising and falling from here.
The mixed messages may mean that only those with a degree of conviction are actively trading these choppy markets. Stat Arb trading models of the big systematic funds could well be responsible for the churn. They account for so much of the daily volume in equity markets that this looks like they are trading against themselves.
With ‘boredom trades’ being the major hazard at the moment, it’s worth cross-referencing different asset groups to get a feel for the market. Carrying out more research will at least remove the temptation to put on weak trades.
USD Showing Strength
The US Basket breakout to the upside marks a significant shift in investor sentiment. Price hasn’t even come back to test the resistance/support line at 93.46. Holding steady above 94.0, the price action points to the path of least resistance being upwards.
US Dollar Basket – 1-year price chart with break out
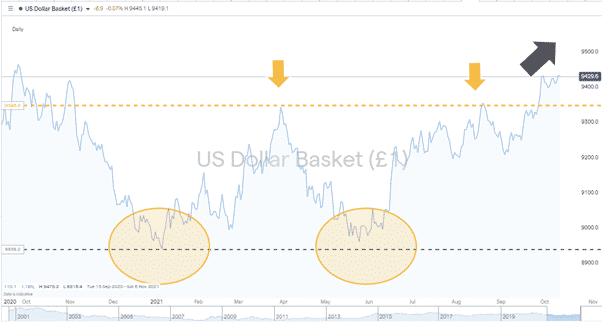
Source: IG
Considering the size of the Forex markets, any move in the USD basket is a signal to all asset groups. With the greenback being seen as a safe-haven asset, this points to risk appetite finally tipping to the downside. There is the chance that earnings season ‘beats’ do enough to counter negative sentiment, but the dollar is the market to watch.
Gold – 1-day candlestick chart – Tight trading range
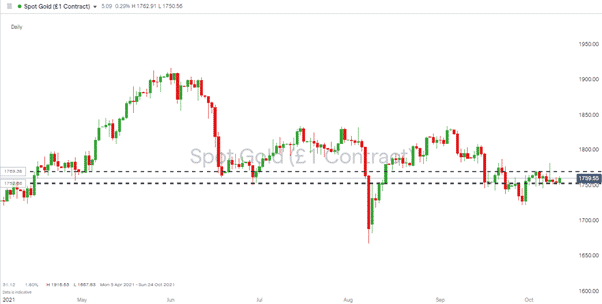
Source: IG
Sometimes inactivity can be its own clue. The Gold market has traded in a super-tight range through October. While other markets have seen price scattering in different directions, the world’s reserve asset has hardly moved.
- US Crude Oil: Up > 8%
- Bitcoin: Up > 32%
- Copper: Up > 6%
- Natural Gas: Down > 8%
It’s hard to call on what the above price changes since the 1st of October mean, but the feeling is that as gold has resisted the temptation to join the price volatility party, it could be a clear sign when it does break.
If you have been the victim of a scam, suspect fraudulent behaviour, or want to know more about this topic, please contact us at [email protected]
 Your capital is at risk
  Your capital is at risk