For everyone on Wall Street, October was interminable. It just would not end. Even the optimists reviewed history and discovered that, even as bad as the month tends to be on equities and trading in general, the historical record revealed the last few days of the month were usually filled with previous bounce backs. The “Dead Cat” came out of the shadows before Halloween and brought cheer for overwrought investors. Such was not the case this time around, no ending rally in sight. Yes, the S&P 500 index did run up to 2719 on Wednesday, having started the week just below 2700, but we doubt if anyone would describe that brief “burst” as a display of strength.
Read more forex trading news
What did transpire over those last fateful days was the same rhetoric that analysts in greater numbers had been shouting from the rooftops – a recession is coming. It is actually normal for one or two negative souls to surface every week and claim they know exactly when this record-setting Bull market will end and at what point the dreaded recession will commence. One brave advisor type has prognosticated both events down to the time of day. His guess for a dying Bull is May 19th, 2019 at 4:00 PM. The recession will begin exactly seven months after that eventful day in history. Now that we know, we can all go back to our desks and complete whatever it was that we were doing.
Every realist knows that this Bull market cannot continue forever. Yes, a recession is inevitable, but there will be no easing into this one. The preponderance of articles using the “R” word has definitely taken a sharp turn in the northerly direction. Everyone and their Grandmothers are now making predictions, using their favorite indicators, set of data, or proprietary chart that must be based on pure science, if their confidence level is to be accepted and believed.
One of these days, an enterprising individual will take a dozen of the most respected financial websites and newspapers, scan a fixed set of pages each day for the use of the recession word, and then chart the data as his or her one and only Recession Confidence Index. When it crosses a specific level, then bar the doors and windows – a big storm is coming. If the chart is correct, not necessarily down to the day and minute, then constant praise will be in order, the prize for winning the guessing contest. If wrong, then surely someone else got it right.
The one problem that few analysts and creative authors have focused upon is that their process is flawed from the beginning. Every economic model that is used to predict recessions and that has stood the test of time typically involves following a selected number of data points. A Yield Curve Inversion may be the exception, but it is only a signal of doom roughly 12 to 18 months in advance, not exactly a timing warning at that. Even economists have difficulty explaining why the inversion works as a good signal provider, so let’s pass on that one. By the way, long-term yields did bounce back, ending the mild hysteria that had pervaded negative viewpoints.
The next possible exception is that there is always a recession exactly seven months following a peak in our major indices. The only problem with this notion is that when do you know the “peak” has been reached and then passed, thereby sending the alarms. This alarm bell has been wrung so many times in the past three years or more that no one is paying attention anymore. Chicken Little has spoken – the sky is not falling.
But getting back to the major problem at hand – the prior two quarters worth of important economic data releases, and sometimes more, are often revised, once a complete data set is received and any prior estimates used to fill in the holes are no longer in play. The infamous example here is the Great Recession. The National Bureau of Economic Research (NBER), as we recently wrote, “announced the economic peak of the last cycle as being December of 2007, twelve months after the fact.” Unfortunately, no one warned Ben Bernanke in January of 2008, before he said, “The Federal Reserve is not currently forecasting a recession.”
What are a few of the latest “surefire” recession predictors suggesting today?
Let’s start with an easy one, the U.S. Unemployment Rate:
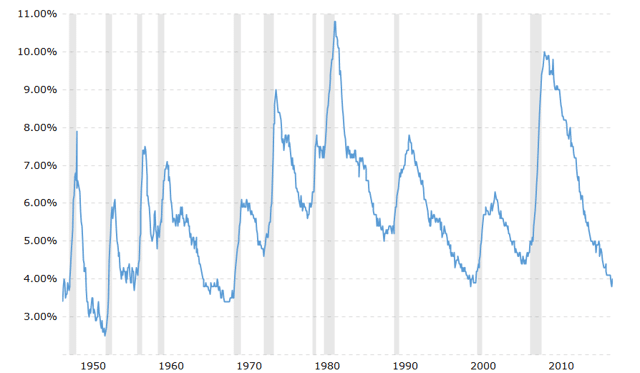
A number of clever analysts have suddenly latched onto this recession predicting method, as if no one had ever noticed it in the past. If you step back in time from the present, it is easy to detect that unemployment spikes just before a recession takes hold. The normal caveats would apply regarding backward revisions of released data points, but the correlation seems incredibly good, especially taking note of the fact that we are only using one variable. Most credible models incorporate from four to seven, even to ten, various economic factors to deliver their predictions.
Last week’s Non-Farm Payroll release was viewed as “Not As Good As Advertised”, even though net new job additions came in at 250,000, some 57,000 above expectations. Prior period revisions were a “wash”, but the total was nearly 8% below the same figure from a year ago. The unemployment rate remained unchanged from the September rate of 3.7%. Nominal hourly wages also increased Y-O-Y by 3.35%, a healthy sign that inflation is beginning to creep into the mix. Other indices suggest an inflation figure of from 2 to 2.5%, such that wage gains are positive in a real sense. In other words, the report was regarded as “good”, but not “great”.
Will one more flat unemployment data point do much to the chart shown above? The veracity of this indicator alone comes into question when you look back to 1965 or back to the fifties. One analyst noted that, “While the economy can muddle through with low unemployment rates for years, rates this low simply do not last. They indicate an economy working at capacity, with minimal room for continued growth.” Wage inflation is also supposed to indicate the same thing, but on the ground, people seem to have multiple low-paying, part-time jobs. When will “slack” force more full-time openings?
What about the Yield Curve being used as a probability predictor? (See below):
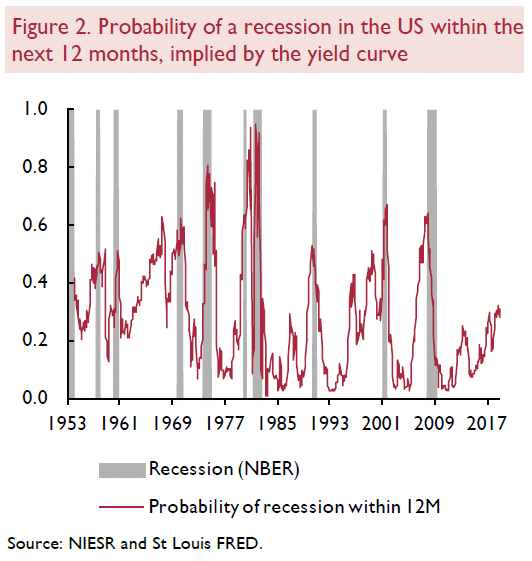
One probability model using Yield Curve data produced the chart depicted above. Its accuracy is questionable, although every time the Red Line reaches a 50% level, it is time to start the fabled “Recession Watch”. Guggenheim Investments, another firm that has a twist of its own on this model, produced this prediction back on 29 October 2018 – “Our Recession Probability Model and Recession Dashboard continue to suggest a recession is likely to begin in early 2020. Investors ignore the yield curve’s signal at their peril.” By the time 2020 roles around, be sure to remember that you saw it here first.
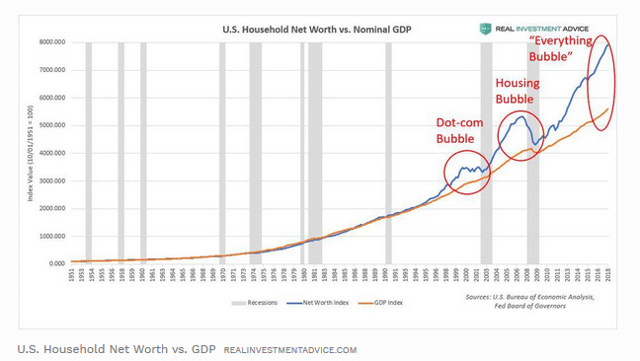
Whether we like it or not, cheap money and easy credit have led to a binge of sorts, creating asset bubbles in multiple sectors. As the Fed continues with its tightening regimen, the consequences of this “debt binge” will arise. Per one analyst: “The CAPE ratio, market Cap to GDP, U.S. household net worth to GDP, and corporate debt to GDP all scream overvalued. Whether examining market runs, valuations, unemployment, consumer confidence, or the ISM (Institute of Supply Management) survey, one thing will become abundantly clear: we are at record highs nearly everywhere you turn.” Here is just one chart that “screams overvalued”:
Peter Schiff, a well-respected stock broker, radio commentator, and founder of various investment firms, has been very critical of the U.S. economy. He has recently stated that, even though Trump seems to use Jerome Powell, his pick for Chairman of the Fed, as his favorite scapegoat for anything of a negative economic nature, “There will be plenty of blame to go around when the next crash grips America. And this one will make 2008 look like the roaring ’20s.”
More importantly, with respect to “asset bubbles” in the economy at every turn, he noted that, “Bubbles don’t need a reason to deflate. That’s just what they do. And when you look at what’s happening in the stock market, realize that this is happening in the real estate market. This is a big decline in assets that were propped up artificially cheap money that is no longer as artificially cheap. And as people watch their home equity evaporate and their retirement savings go up in smoke, what do you think is going to happen to spending? What do you think is going to happen to GDP? This is just not a decline. This is a recession that is coming, and it’s going to be a brutal recession because there is absolutely nothing the Federal Reserve can do about it.” Ouch!
Lastly, we should make mention of our favorite Recession Model, IM’s “Business Cycle Index”. Here is the latest update, as of last week:
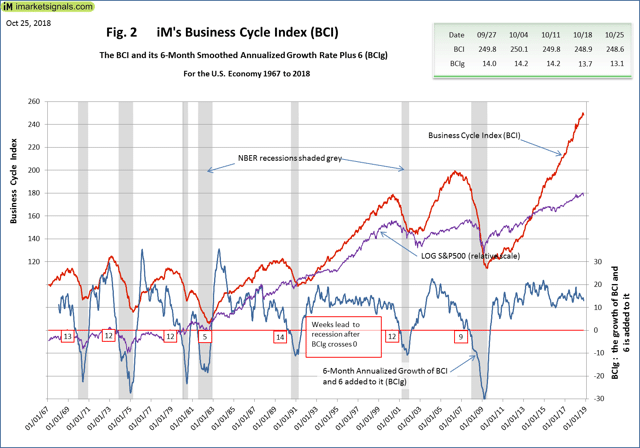
The “Blue Line” at the bottom of the chart is the important indicator to watch. Our record Bull market can be seen beating out the run in the nineties, but the course of the “Blue Lines” seem eerily correlated in some way. The BCI Index uses seven key components of economic activity to generate its forecast. The latest pronouncement from the folks at iMarketSignals is that there are no signs of recession on the near-term horizon. I suspect they will become concerned when the Blue Line pierces the “10” value level.
Concluding Remarks
When will this Bull market finally run out of gas? Will a recession commence exactly seven months hence? Predicting stock market peaks is never a profession free from high casualty rates. Every veteran that mentors an aspiring trader or two will always counsel his pupil that bottoms and peaks are nice positions to have in a market, but accurately predicting them is a fool’s game. He will then tell you about the scars he has to prove this notion. Find the trend, confirm it, then jump onboard, if you truly want success in the market.
When will the Bull stumble, i.e., when will the market correct over 15%? Here is one wise opinion: “This bull market could last another six months, year, two years, or even five. However, with multiple indicators signaling an imminent economic downturn, investors should remain conservative. This is the longest bull market in history. Our current bull market began on March 9, 2009, and is still going strong at nine years and six months.”
Stay cautious!
 Your capital is at risk
  Your capital is at risk