Monday’s lack of risk appetite ahead of crucial data announcements on Wednesday and Thursday has rolled over into the start of Tuesday’s trading session.
Long-term investors may be biding their time and preparing to digest the US CPI (released Wednesday) and PPI (released Thursday); however, short-term strategies appear to be picking off momentary moves in sideways trading markets. A price break-out seems to be off the cards for the next 24 hours, but there are still trading opportunities for those willing to trade tight trading ranges.
GBPUSD – Support at 1.38403
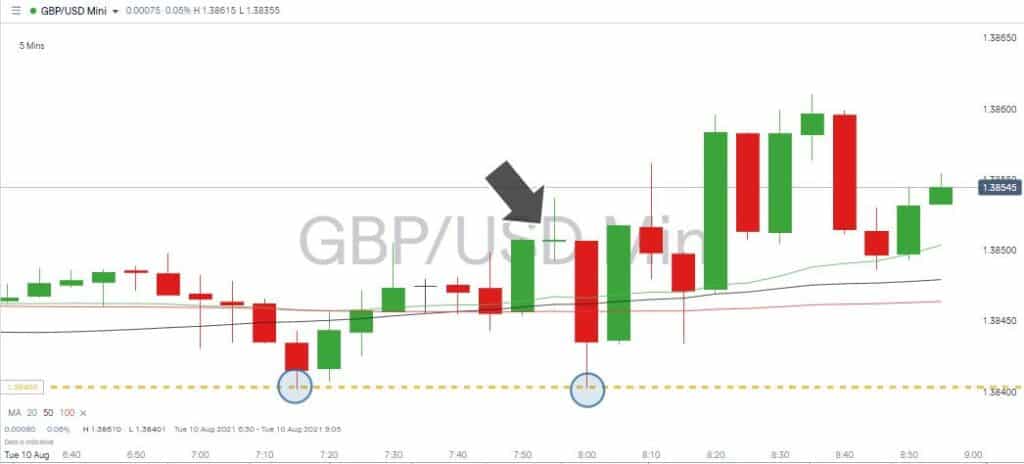
Cable’s start to the working day was preceded by a doji candle on the 5-minute price chart. The breakthrough of the lower level of the doji after the opening bell would have been a signal for many. The move from 1.38492 to 1.38403 would have netted a nice return, but market uncertainty led to that price shift quickly reversing.
GBPUSD – Pre-open Doji on 5 Min Chart

Source: IG
With GBPUSD now trading above the opening price level of 8.00 am, the support at 1.38403, which is also boosted by the earlier bounce from that level, appears to be a significant barrier to downwards movement, at least in the short term.
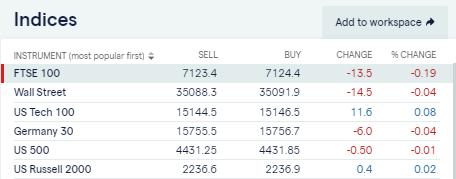
Soon after the open of European bourses, major equity and futures indices were trading within a range of -0.19% and +0.08%.
Major Equity Indices – Tuesday Morning – UNCH

Source: IG
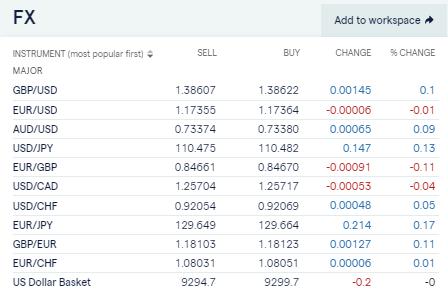
In the forex markets, the story was the same. Major pairs traded within a range of -0.11% and +0.17% with the fulcrum of the currency markets, the US Basket posting a 0% change on the day.
Major Forex Pairs – Tuesday Morning – UNCH

Source: IG
Looking to Treasuries for a Steer
There are worse ideas than trading the ranges found across a lot of markets on Tuesday. The bond market has indicated it’s set at current levels until the US inflation data is released before the US markets open on Wednesday.
The yield on the benchmark 10-year US Treasury note slipped 14 basis points to 1.3152% on Monday. At the same time, longer-dated bonds flat-lined with the 1.9617% yield of the 30-year US T-bill remaining unchanged through much of the day.
Where’s the Volatility?
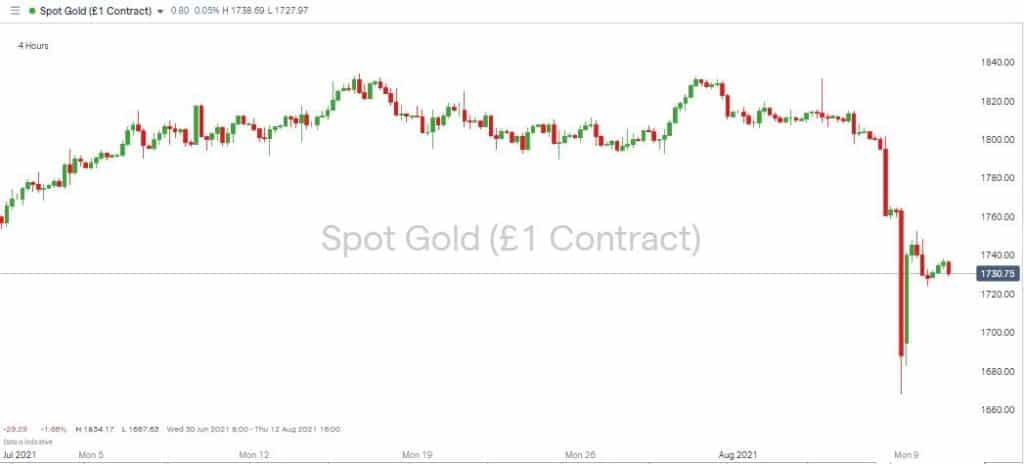
While equities and currencies are stalling there, have been significant upticks in volatility in crypto and gold. Bitcoin was up 4.5% on Monday and printed above $45,000 for the first time since the middle of May. Gold, which has sometimes been associated with BTC as a safe-haven asset, headed in the other direction. The divergence was noteworthy in its own right, but the scale of the move was something else.
Gold’s Flash Crash

Source: IG
The price of gold slid by more than 7% in the space of 16 hours. The unusual move might suggest holders of the metal are more jittery about the US inflation data reports than the rest of the market. It also gives a pointer to how prices in all asset groups might react if there are any surprises in the news release.
If you want to know more about this topic, please contact us at [email protected]
 Between 74-89% of CFD traders lose
  Your capital is at risk
  Your capital is at risk
  Your capital is at risk