September has come and gone. It has traditionally been a bad month for financial markets. The story goes that returning vacationers hit their desks running, filled with uncertainty, and then pull back from whatever strategy was in place, churning the markets to lower support levels. This September followed the rule, falling some 3% on the S&P 500 index, and, when combined with a nasty month for August, it is no wonder that pessimism is sweeping the investment world.
And now we have October, another month of ill repute. The crashes of 1929 and 1987 occurred in October, and, for those reasons alone, investors and analysts are tending to be a bit skittish of late, to say the least. For the past three years, a host of doomsayers have been predicting an end to the current Bull market. The names of these folks are not ones on the tips of your lips, perhaps, because the dreaded crash never came, but lately, when the likes of Robert Shiller and Carl Icahn decry the bubble in stock market valuations, one must take note.
The good news, however, is that there remains a cadre of optimistic, though guarded, analysts in the public domain that do have stellar reputations for forward thinking. They, too, are feeling the uncertainty of the current situation, but they are still positive about what may come regarding the global economy. These analysts look to price action to determine investor sentiments, not surveys that are suspicious at best. Yes, the highly anticipated 10% correction finally appeared over August and September, but the market recovered. Last Friday, investors reacted negatively to a tepid jobs report, but the market came back. If there is a “crash trigger” out there, no one has found it… yet.
What is the basis for this uncertainty surrounding a “crash trigger” concept?
We have already highlighted the comments and opinions of Robert Shiller in a previous article. He was asked by reporters in mid-September to opine once again on his famous CAPE index. During his interview, he continued to note the unusually high P/E values in the S&P 500 index. After his adjustments, there were only three times when values were higher — 1929, 2000, and 2007. Shiller conceded that timing was an issue. He could not predict when a major pullback might occur, but he was currently concerned with the recent fall in investor sentiment regarding stock market valuations.
From his perspective, investor sentiments were worrisome, when combined with high stock valuations. The last time investors had worried this much was right before the Tech crash in 2000. Would this combination provide the dreaded “crash trigger” in the near term? The situation got darker still when reporters went straight to Carl Icahn for his judgment on the so-called trigger. He, too, felt stocks were heavily overvalued, but he also added that corporate accountants had used every trick in the book to keep earnings up, the denominator that drives the numerator in the P/E calculation.
The current uncertainty, however, can be traced back to other issues: near-zero interest rate policies from central banks and the need for rate hikes; falling stock prices and slowing economy in China; falling demand for oil and other commodities; the draining of capital from emerging market economies; and the inability of Europe to implement necessary structural reforms to enable stable economic growth. These are unusual times. Even Professor Shiller is undecided: “Something funny is going on. History is always coming up with new puzzles.” It looks like a few puzzle pieces might be missing.
But the search continues for “trigger” or catalyst or whatever name you wish to assign to the force that causes the initial domino to tumble. Many analysts felt that an interest rate hike from the Fed would surely start the process, but the Fed had telegraphed a 25 basis-point change for so long that no one feared an avalanche. When they deferred again, no one blinked.
The latest sanguine analysis that makes logical sense is tied to interest rates in a way. In this domino theory, the following sequence of events would transpire:
1) There is over $200 billion in shale oil debt securities. The fear is that an extended drop in oil prices would put significant pressure on the profitability and resultant cash flows in this industry. If a meltdown occurred here, it could then spread to junk bonds and eventually to equities;
2) Corporate and junk bond debt markets have bubbled up recently due to investors chasing after higher returns in a low interest rate environment. Demand has, however, kept risk values below what they should be. As investors begin to assess the true risk, they will exit quickly. Many analysts believe that this meltdown is already in progress;
3) The run on China stocks is far from over. The Bank of China has intervened, but wise investors will want to shift loyalties, even from what are regarded as the Blue-Chips in this market;
4) Private equity raises and IPOs will not be as easy or reach the astronomical levels of previous issuances. Expectations will be downgraded to offset losses on previous deals with pressure coming to cover debt that was used to fund the enterprises in the first place;
5) Lastly, equity selling from sovereign wealth funds in oil-exporting countries has already begun. The fall in oil prices has already forced many of these nations to reconsider the allocation of foreign reserves and long-term investment strategies. Expect more of the same.
Central bankers have been warning of an impending liquidity “crunch”, when investors suddenly try to liquidate positions in global bonds and equities, but buyers are nowhere to be found, the same situation that led to the Great Recession. Investors have chased returns across the globe for the past decade, without a great deal of concern about risk. But, like greed and money, risk never sleeps. Most of the problem securities are in low-volume, high-risk, over-the-counter venues and are leveraged up to the hilt. When the margin calls come, and they will, there will be Hell to pay at some point.
As you might expect, there is a killer-chart that has been prepared to highlight the issue surrounding margin debt and past historical events. With cheap money and low-cost debt in abundance, investors have also taken the opportunity to leverage their positions in the market to another all-time high. This week’s award for the best chart goes to the following insightful diagram:
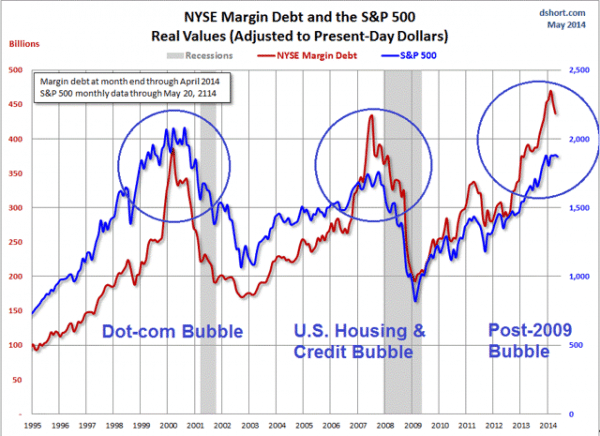
Once again, we can easily see history repeating itself, right before our very eyes. These are unusual times, but simple pattern congruences like above make us think otherwise.
What are the arguments that optimists are putting forward?
As much as pessimists try to beat down buying activity, it comes back with a flurry. Optimists gauge the present as a healthy pullback, a normal occurrence where profit-takers move in and new investors buy for future gain. Yes, there is uncertainty, and no one is discounting charts like the one above, but they are taking a longer-term view and see no possibility of a domestic recession on the horizon. Yes, the global economy is in flux, still adjusting to weaker demand from developed economies, but here are many positive signs on the domestic front:
1) The good news in the recent jobs report, according to an analysis by Sentier Research, shows “that median household income, adjusted for inflation, grew by $615 in August, to a post-recession high of $55,794. Real incomes are still about 2.7% lower than they were in 2000, indicating ongoing stress on American consumers. But the trend is improving after a period of stagnation.”
2) Auto sales continue to be robust, hitting levels that are the strongest on record, 18.2 million on an annual basis;
3) Construction spending, while still below pre-recession levels, is increasing at a stable rate, a sign that consumers are investing in new housing starts and that commercial builders are focused on the future;
4) Jobless claims are at their lowest levels since 1973. September net job additions may have only been 142,000, but the other takeaway is that employers are not laying people off in large numbers either.
As has been said many times during this extended recovery, economic progress continues to be gradual and steady, nothing dramatic, but progress just the same. It is important to remember that our economy is service driven. Manufacturing may only account for one-third of economic activity, although some analysts can make a case that this figure is improving, as well. A service economy, however, cannot grow unless median household incomes are growing. Optimists point to this chart, as evidence that we are on the right track with more room to go:
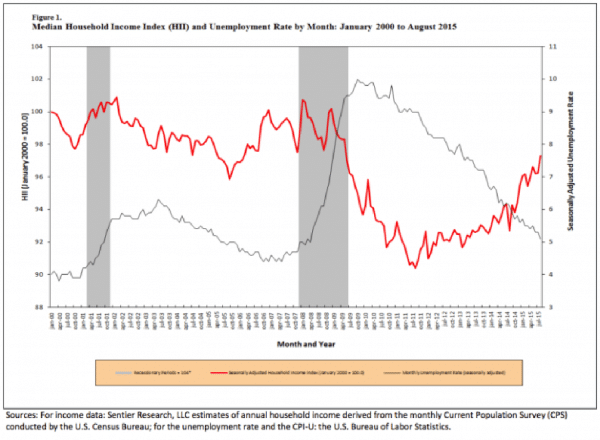
The Red line tracks a Household Income Index, while the Gray line depicts a seasonally adjusted unemployment rate. As noted above, we are still below pre-recession levels, but improvement is real and stable, with more room to spare. Yes, it has been a long recovery, but banking related recoveries always take more time to repair, and the Great Recession was just that – a global banking disaster and a “Great” one at that.
Concluding Remarks
Pessimists may be dominating the airwaves these days with predictions of gloom and doom, but even they equivocate their dire forecasts. One noted analyst keeps saying that the S&P 500 will drop back to the 1500 level, re-testing levels of support established by the last two recessions. When queried as to when this re-test might happen, this analyst’s response lacked conviction. “The odds have increased” was all that he could muster. Others in the same camp point to 2016 as the year of final accountability. Time will tell on that score.
In order for the dreaded “crash trigger” to be pulled, however, current buyers must be dissuaded and must join the ranks of the “glass-is-half-full” crowd. Whenever the shift in ownership positions begins, there is one certainty – foreign exchange markets will be in turmoil. There may be a brief period of gradually increasing volatility that precedes the liquidity event, but that will be another signal that there is money to be made as a forex trader. You may want to check the historical record for which currency pairs provide the greatest predictability when previous crunches occurred. Preparation is everything in this case, so that, when the balloon goes up, you are ready with a plan to cash in big time.
Stay tuned and be safe!
 Your capital is at risk
  Your capital is at risk