It was the best of days; it was the worst of days. Wednesday and Thursday may have been two of the “worst” days, but Friday has been about recovery. Our record-making Bull market just keeps plugging along, despite the screaming and yelling over the past few days. What is puzzling for analysts, however, is that there is no clear consensus on why the slight correction occurred, although many felt they were being drawn into a black hole of sorts, until fresh air returned to the room. The question on everyone’s tightly closed lips: Was this rout a temporary sell off or is Armageddon near at hand?
Read more financial news
One analyst put it this way: “There does not seem to be an obvious trigger for this equity rout. Most narratives link it to U.S. rates, trade tensions, and/or positioning around earnings. While any of these could be the spark, many investors also realize that none is needed. Moreover, none seem compelling, and it is precisely because of this that the market’s fever may burn itself out.” If you check with veterans that have been down this road many times, they speak more about volatility-driven “black boxes” and a sudden flip of stock/bond correlation factors, an obscure topic that many insiders follow closely.
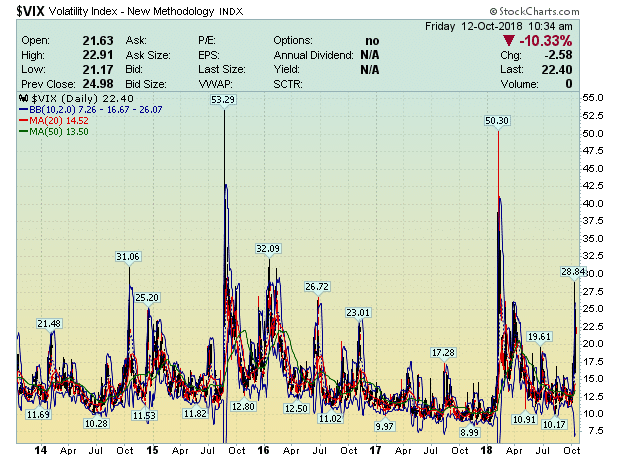
When in doubt, look to the VIX for answers, an adage that seems lost, as this latest storm blew through financial markets across the globe. The noise level for the VIX, the closest index we have to measuring volatility in the stock market, tends to be in the 10 to 15 range, but when it spikes, it signals all hands on deck. For those of us that recall the panic in the streets that transpired back in February, the VIX hit a high of 50. You have to return to 2015 to find a higher spike value. The latest scare, however, did not even reach 30. What is going on behind these vagaries in equities and bonds? Are we headed for disaster or is the latest “bump” actually healthy and normal?
Everyone likes to blame the Fed – Is there any credence to this argument?
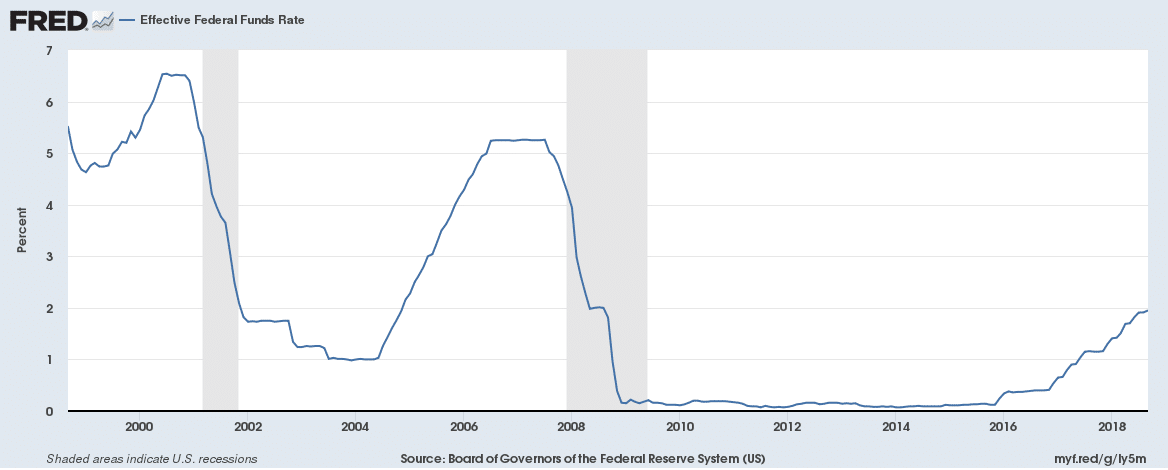
The Fed recently raised its benchmark rate another 25 basis points, and Jerome Powell’s data-driven group of bankers have committed to another raise in December, although many analysts are already pushing for a delay in that proposed rate hike. President Trump is also waxing bellicosely towards the Fed, but his verbal outbursts are lately being regarded as “stupid” by most Fed watchers. The Fed members stopped listening to his protestations long ago. If you review the history of rates for the past 20 years, we are far from “normal”, which is what normalization policy is all about:
Every investment analyst understands that low interest rates and cheap money favor our equity markets and that a tightening process can only work toward an equity pullback, as earnings suffer. Liquidity, however, is at an all time high. The world is awash in liquidity across the planet, as well. As for rate hikes impacting earnings, the answer is “yes”, but with the amount of additional stimulus that has been pumped into the U.S. economy from tax cuts, stock buybacks, and repatriation of earnings from overseas, the last rise in interest costs should have a negligible effect on earnings going forward.
Once reporters got past the verbal tirades that were fear driven, they began to seek out the saner voices on Wall Street. One expert on the history of such market moves was quick to add that a small adjustment, such as a 5% drop over two days, is consistent with the Fed raising its benchmark by only 25 basis points, nothing to worry about in his opinion. The market is strong, but there are other headwinds at play that could impact the economy adversely. Tariff hikes on Chinese goods are at 10% for $250 billion of projected imports, but another 15% goes into effect on January 1st.
The next anti-Fed argument follows the line that inflation might rocket upward, causing the Fed to overreact and raise rates too high, too quickly. Most naysayers jump to the assumption that investors will then overreact, too, bringing about the dreaded crunch, where sellers are in abundance and buyers are hiding in the shadows. CPI data released this week told another story. Inflation is not dormant, but it came in below expectations. The various forms of CPI results fell within a 2.2% to 2.7% annualized growth rate, nothing like the hyper values that many economists were expecting. As for the Fed, Chairman Powell is on the record stating that a strong economy does not necessarily imply strong inflation, a quote that even Trump endorses.
The last Fed argument gains strength when the infamous “data plot” is made public. Each Fed governor projects where they believe rates should be in the future, which is then depicted in a diagram like the one below:
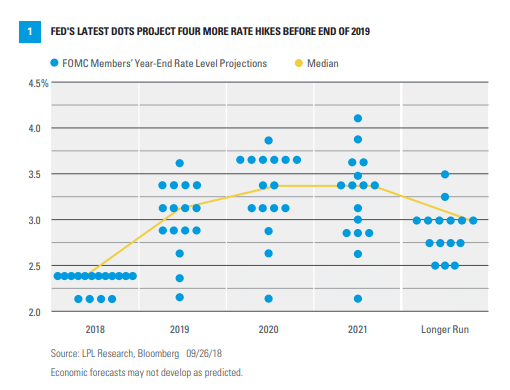
By 2020, the median projection falls below 3.5%, which is a “neutral” level within the context of the two-decade diagram presented earlier in this narrative. From that perspective, the Fed is still in an “accommodative” mode. Overreactions do not seem to be in the cards from this group of Fed governors.
For the last three months or longer, the loudest hype in the press has been about the flattening yield curve. All manner of storylines have focused on the point that a reversal in the yield curve, i.e., the point where long-term yields are less than short-term yields typically between 2 an 10-Year Treasuries, has been our most reliable indicator, when it comes to predicting an oncoming recession. For as far back as you want to go, a reversal in the yield curve has preceded a recession by 12 to 18 months. There have been no exceptions, but old rules may not apply due to central bank heavy handedness. The recent rise in rates has steepened the yield curve, such that no one has recently mentioned a reversal and what it could imply.
What other arguments seek to explain this latest market downdraft?
If you bypass the histrionics of floor traders on the stock exchange or the talking heads on most any financial news channel and turn to the veterans that tend to avoid the limelight, you begin to see what might be the real reasons for our recent bumps in the road. In this vein, there are two major contenders, both related to a degree. Both arguments posit that the issues relate to infrastructure problems that have evolved over time to such an extent that the severity of market downturns will be exacerbated by uncontrollable factors, namely algo-driven trading routines and reactions to obscure stock/bond correlations.
The “Quants” and their Algo-driven “Black Boxes”
The constantly evolving trend within banks, fund managers, and hedge funds has been for the past three decades to develop and rely upon automated trading routines. A new breed of math whizzes, so-called “Quants”, used highly sophisticated software to trade the markets. They conquered Wall Street and nearly destroyed it leading up to the Great Recession. These trading routines have only gotten more sophisticated and complex over the past ten years, such that market insiders fear that, when the next big sell signal is generated, these routines will turn in unison and bring about a sudden meltdown.
Firms may release a few of these trading-bots at the opening, but then turn off all but the highest performing one for the day. Successful strategies vary, depending upon market conditions, but the most efficient models follow closely momentum and volatility trends, sometimes reversing on a dime. Per one concerned analyst: “Over the past decade there was strong growth in Passive and Systematic strategies that rely on momentum and asset volatility to determine the level of risk-taking (e.g., volatility targeting, risk parity, trend following, option hedging, etc.). A market shock would prompt these strategies to programmatically sell into weakness.” We had a mini-shock this week.
The Flip of the Stock/Bond Correlation Curve
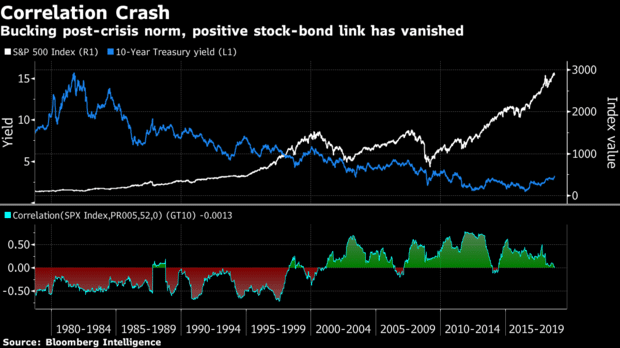
This premise starts with quickly rising yields in the bond market that rise too quickly, a result of a widespread bond sell off triggered by inflation jitters. If the sell off occurs not too quickly over a few weeks, then the equity markets have a chance to digest the sorting out process, but, if not, then the worst of both worlds can be a nightmare – the sell off spreads to equities, as well. Bonds and stocks have performed well over the past 30 years, due to a period of moderating inflation. One could generally hedge their bets by re-allocating capital between both asset classes, but the new trend is worrisome.
It is a rare day that bond and stock prices fall on the same day. It occurred several times in the first quarter of this year, especially when markets went apoplectic in February. As one analyst dissected the carnage, he noted that, “Both the S&P 500 and Bloomberg Barclays Aggregate, a popular bond index, lost more than 1 per cent in the first quarter — only the fourth time this has occurred in the past three decades.” When bonds and stocks fall at the same time, it can wreck even the best of portfolio strategies.
There are rather arcane charts that follow this correlation trend. It is not only a U.S. phenomenon. Similar relationships exist in Europe. In the chart below, S&P 500 trends are plotted together with 10-Year Treasury yields. When the “correlation”, depicted on the bottom of the chart, “flips” to the negative, then equities plummet subsequently down the road. The concern was that the correlation was near the “Zero” point. The concern, however, dissipated, when investors returned to treasuries, but the damage had been done.
Concluding Remarks
Make no mistake about it – Financial markets are struggling. U.S. stocks have recorded losses for three straight weeks, and the loss for this past week has been the largest since March. More research will follow, as analysts dissect the data to get at the heart of the causes, since that understanding will be vital for maneuvering through the obstacles and headwinds that are foreseen in the near-term future.
All Bull markets must come to an end at some point, but the question is always when, followed by how large of a correction is necessary. If you thrive on volatility in the forex market, then shifting capital flows about the globe should increase the propensity for trading opportunities at every turn and for every major trading pair in the market.
As always, prepare your plan, grab a prevailing trend, and ride it for all that it is worth!
 Your capital is at risk
  Your capital is at risk