
The ‘How to Trade Tapering’ case study/trade idea from Tuesday is in profit. There is some surprise about the strength of current momentum, and even those not holding a position might do well to track its progress. With a range of tapering induced unwinds in the calendar, getting a feel for the strength of the market moves would prove valuable.
Long Aussie – Short Kiwi – Tuesday’s Trade entry point 1.04571
AUDNZD – Daily price chart – Aug 2020 – Oct 2021 – Trade entry point
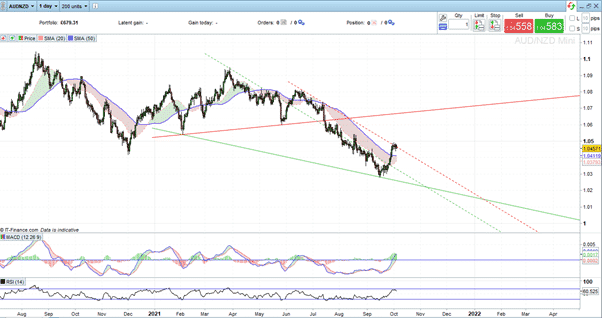
Source: IG
AUDNZD – Daily price chart – Mar 2021 – Oct 2021 – Trade entry point
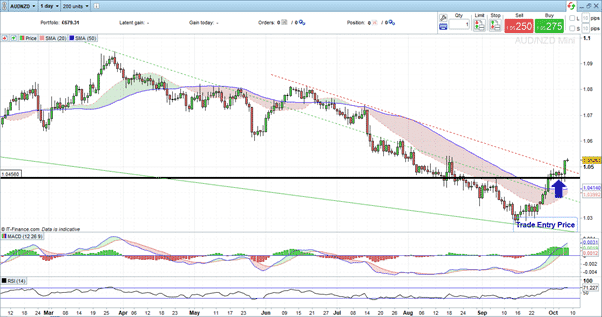
Source: IG
AUDNZD – Daily price chart – 12th Aug 2021 – Oct 2021 – 2 days after trade entry point
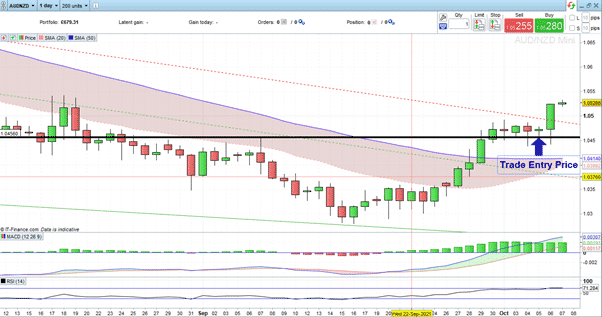
Source: IG
On the two-month price chart, the daily RSI has breached 70, but this has not yet converted into weaker price action. Cross-referencing to the 16th and the 30th of August, times when the RSI touched 30 and suggested the market was oversold, price continued to fall, so the trigger of 70 doesn’t at this point suggest exiting the trade is required.
The Forex Traders analyst note of Tuesday highlighted how the AUDNZD situation is where CFTC data was pointing to record shorting of Aussie and buying of Kiwi. The downward trade was overcooked – hence price did not bounce when RSI was at 30, so we can expect something similar. RSI of 70 might prove a relatively unreliable indicator as the previous trade unwinds.
Resistance from the red dotted downward trend line was blown away in Wednesday’s trading. The pent up overextension of momentum in both currencies opened the door to a dramatic move which was confirmed when the RBNZ announced a 0.25% interest rate rise and removed any doubts about base rates rising by 50 basis points. For those who are long, the size of Wednesday’s green candle is a welcome sign that there is a groundswell of buying pressure in the market.
Potential Target Prices
Target price 1: Current price level of 1.0535 forms the first sell indicator thanks to the 38.2% Fib level dating back to the year to date high on 25th March
Target Price 3: The 50% Fib level comes into play at 1.0614
Target Price 3: The initial price target of 1.07 referenced on Tuesday was based mainly on the trend line support between the lows of the 4th of February and the 26th of May. Given the gradient of the current trajectory, price might hit that line before 1.07. The speed of the current unwind is quite significant, but no trends last forever.
AUDNZD – Daily price chart – Mar 2021 – Oct 2021 – Trade entry point
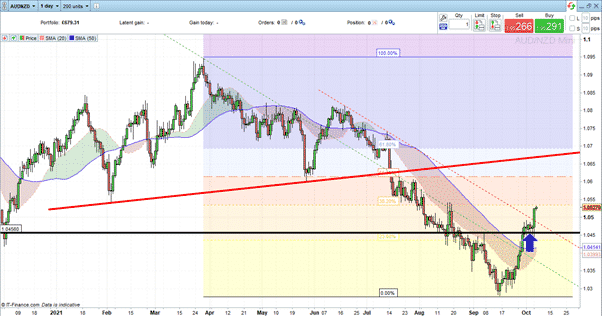
Source: IG
Potential Stop Losses
Potential Stop loss 1: 1.04141 – current Daily SMA
Potential Stop loss 2: 1.04571 – trade entry point/break even
Potential Stop loss 3: 1.04810 – just below the red dotted resistance line, which should now form support – the most conservative stop loss but locks in some profit on what is already a winning trade.
If you have been the victim of a scam, suspect fraudulent behaviour, or want to know more about this topic, please contact us at [email protected]
 Your capital is at risk
  Your capital is at risk