
This is a guest post by Aaron Hill, Market Analyst at FP Markets
The Dollar Index Remains Firm
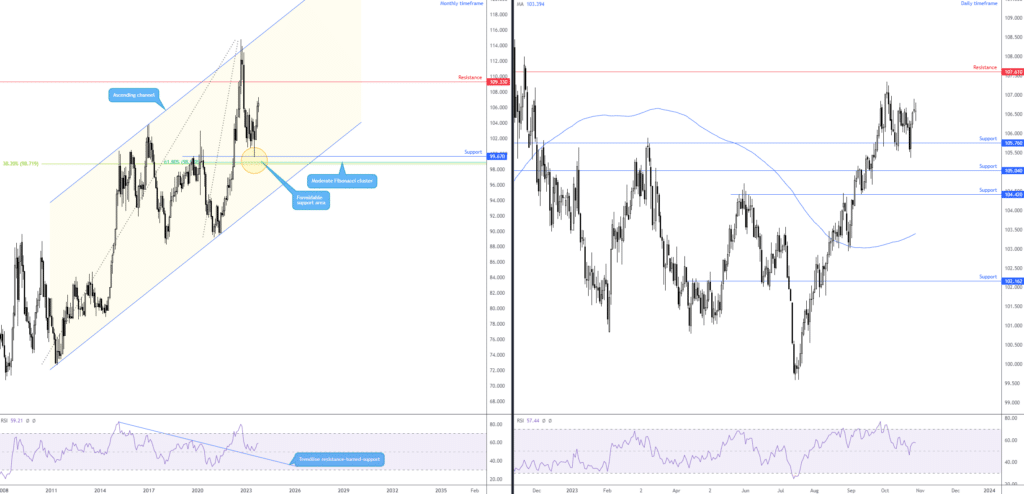
The buck ended the week eking out a moderate gain (+0.40%), according to the US Dollar Index. You will note on the weekly scale (not shown below) that the chart has been rangebound since late September, creating what many technicians will recognise as a bullish flag pattern between 107.35 and 105.54. This is in harmony with the monthly timeframe’s structure and trend. Technical structure, as you can see, exhibits scope to approach as far north as resistance from 109.33, with the trend higher since 2008 that’s currently aided by the Relative Strength Index (RSI) rebounding from just north of its 50.00 centreline (positive momentum). Consequently, although upside momentum has slowed in October (take note of the current monthly candle on track to end in the shape of an indecision candle), USD bulls could remain in the driving seat into the year-end.
Meanwhile, on the daily timeframe, the technical situation shows support remains at 105.76 in a market trending northbound since pencilling in a bottom at 99.59 in July. Thursday’s ‘shooting star’ failed to deliver much in selling, informing traders that the unit is still well bid at current prices and could target resistance at 107.61. You may acknowledge that the previous 105.76 rebound was also aided by the RSI rebounding from the 50.00 centreline and remains in positive territory until touching gloves with overbought terrain.
So, all in all, while things have been quiet for the buck recently, the technical pendulum continues to swing in favour of buyers towards at least resistance on the daily timeframe at 107.61.
GBP/USD: $1.21 Vulnerable to the Downside?
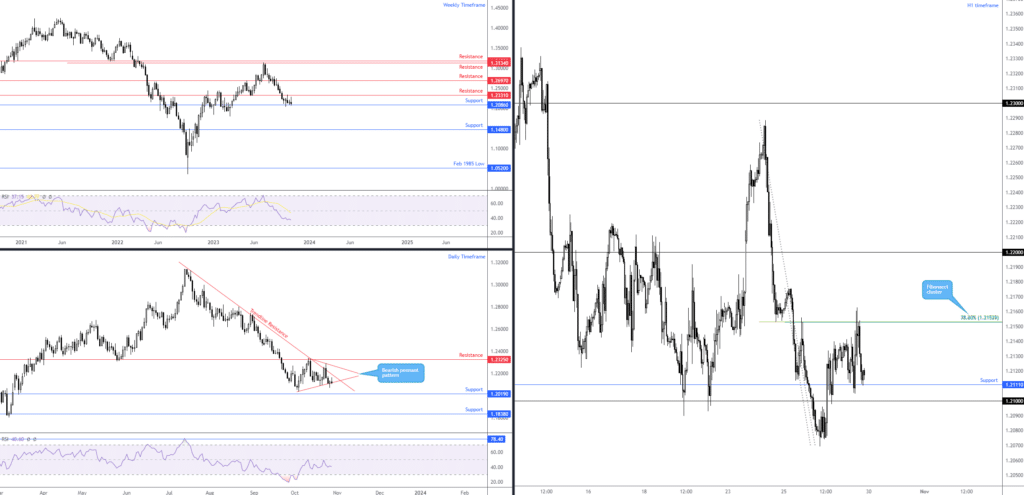
The technical landscape offers an interesting perspective ahead of the Bank of England’s (BoE) rate decision on Thursday. With the market widely anticipating a no-change out of the central bank, price action on the weekly timeframe has buyers and sellers battling for position between resistance from $1.2331 and support coming in from $1.2086. Interestingly, should the aforesaid support relinquish its position over the coming weeks, aside from the $1.1850ish lows, limited support is evident until $1.1480. Clearly, then, $1.2086 support is a key level to be mindful of.
From the daily timeframe, price action is seen compressing between two converging lines ($1.2037 and $1.2337) to establish a bearish pennant pattern at trendline resistance taken from the high of $1.3142. With the pair currently testing the limits of the pattern’s lower boundary and this market trending lower since July, a breakout to the downside could be on the table over the coming days, unearthing support from $1.2019, followed by another layer of support at $1.1838.
Both the weekly and daily timeframes also show the Relative Strength Index (RSI) sub-50.00 (negative momentum).
Across the page on the H1 scale, we can see that the unit momentarily investigated space beneath the $1.21 handle in the second half of last week before reclaiming $1.21+ and retesting neighbouring support at $1.2111. Overhead, the chart also shows price tested a mild Fibonacci cluster at $1.2153 on Friday, made up of 38.2% and 78.6% Fibonacci retracement ratios. Above $1.2153 re-opens the risk of a return to $1.22, while below $1.21 shines light on daily support from $1.2019.
Ultimately, having seen the daily timeframe’s bearish pennant pattern forming at trendline resistance in a market trending lower, along with the RSI on both the weekly and daily charts beneath 50.00, technical selling could remain firm beneath the current H1 Fibonacci cluster at $1.2153. This is particularly likely for those anticipating a breakout lower (daily pennant pattern) to target daily support at $1.2019.
The caveat, nonetheless, is weekly support remains in play at $1.2086. With that, conservative sellers will likely want a H1 close to form below $1.21 before committing.
S&P 500: Major Support Now Active
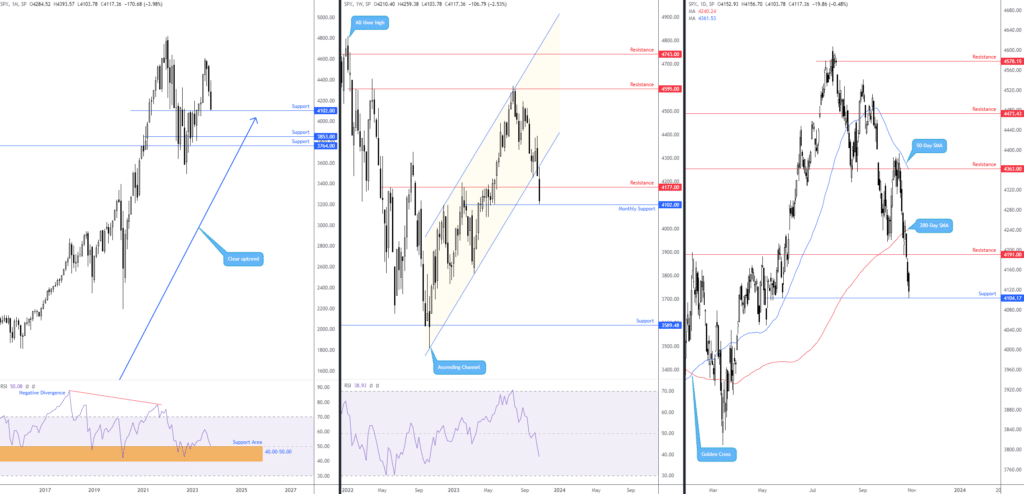
The monthly timeframe—still technically entrenched within a longer-term uptrend—is nearing support coming in at 4,102. Connecting with the aforementioned base would likely witness the monthly chart’s Relative Strength Index (RSI) connect with familiar indicator support between 40.00 and 50.00.
Together with the weekly timeframe’s downtrend, the index ended the week lower by -2.5% and removed bids at support from 4,177 (now marked resistance). Clearing the noted base technically uncovered the monthly support level mentioned above at 4,102. In addition, you will recall that the unit recently retested the underside of a breached weekly channel support (almost to the point), taken from the low of 3,491. You will also note that the RSI on the weekly chart is comfortably beneath its 50.00 centreline, indicating negative momentum (average losses exceeding average gains).
Moving over to the daily timeframe, recent price action, also showing a clear downtrend, is comfortably beneath the 200-day simple moving average at 4,240 after tunnelling through neighbouring support at 4,191 (now marked resistance). Engulfing the aforementioned barrier unearthed further downside towards support at 4,104, which made its entrance on Friday, situated a touch north of the monthly support at 4,102.
Considering the current chart studies, bears may have difficulty at current levels given we have monthly and daily support levels in play. Hence, this may trigger a bout of profit-taking this week, which could draw the index back to retest weekly resistance at 4,177.
Spot Gold (XAU/USD): Third Consecutive Positive Week; Room for More?
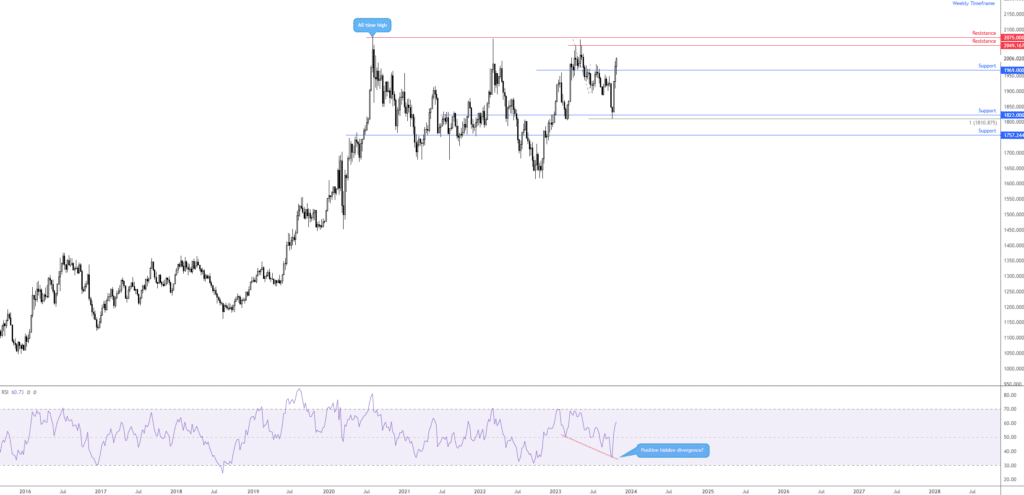
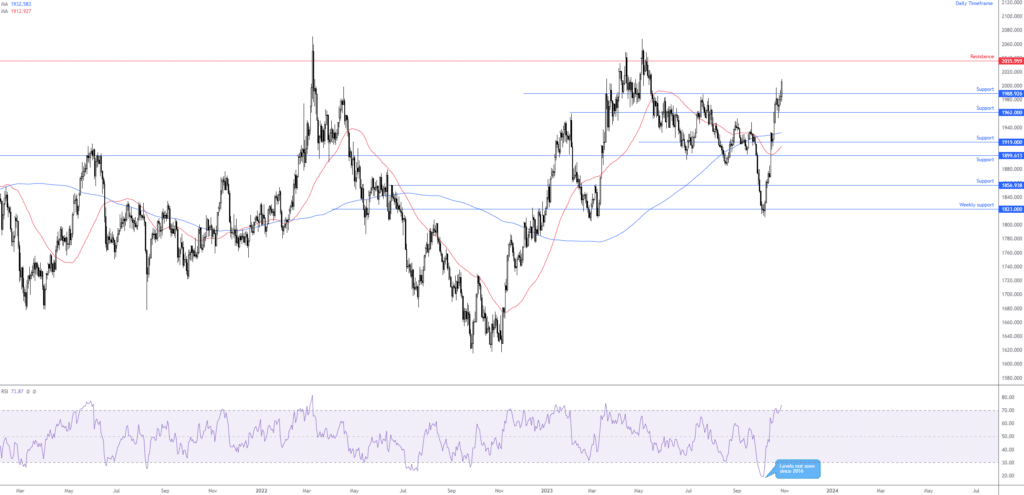
The price of spot gold in dollar terms settled higher for a third straight session last week, adding +1.3%. On a month-to-date basis, the yellow metal is higher by an eye-watering +8.50%, on track to record its largest one-month advance since mid-2020.
What’s interesting, though, is the unit has scope to extend recovery gains this week.
Price action on the weekly timeframe absorbed offers at resistance from $1,969 and, as you can see, retested the boundary as support and held firm. What this means, solely from a technical standpoint, is that XAU/USD bulls still have room to work, targeting resistance at $2,049, which happens to be closely shadowed by another layer of resistance at $2,075—the all-time high. This is further reaffirmed by the Relative Strength Index (RSI) working with space above the 50.00 centreline (positive momentum). From a trend perspective on the weekly scale, however, the precious metal has been largely rangebound since 2020.
Adding to the weekly timeframe’s upbeat technical vibe, resistance on the daily timeframe at $1,988 was dominantly cleared on Friday, along with the widely watched $2,000 psychological barrier, a move exposing resistance at $2,035. This promotes the idea of further outperformance and is backed by an uptrend visible on the daily timeframe, with corrections few and far between since the beginning of October. Nonetheless, it is worth considering that the RSI is seen navigating overbought space. Albeit a red flag for bulls, do keep in mind that the RSI can remain overbought for prolonged periods in trending environments.
Essentially, the technical landscape leans toward additional buying towards resistance on the daily timeframe at $2,035 and nearby resistance on the weekly scale at $2,049.
BTC/USD: H1 Ascending Triangle Will Be Key This Week
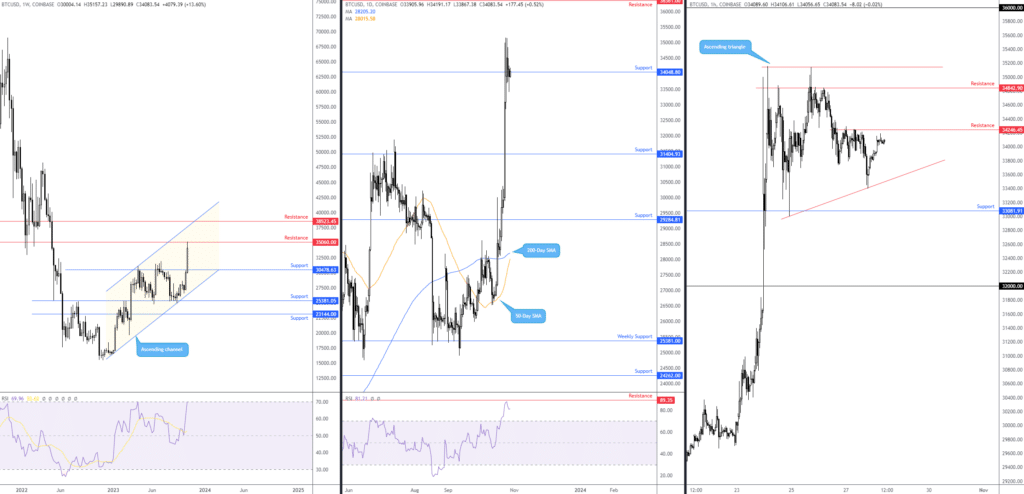
On track to end the month printing its most significant one-month gain since the beginning of this year (+26.0% MTD), last week wrapped up +13.7% higher and touched resistance on the weekly timeframe at $35,060, bringing the major cryptocurrency’s Relative Strength Index (RSI) to the overbought threshold. Below, weekly support warrants attention at $30,478, while rupturing current resistance could see additional resistance at $38,523.
Over on the daily chart, you will note that buyers and sellers ended the week squaring off around support at $34,048. Should buyers take the reins, supported by a possible Golden Cross (50-day simple moving average [$28,015] crossing above the 200-day simple moving average [$28,205]), resistance is seen at $36,361. A concern for buying, however, is that the RSI rotated south just ahead of indicator resistance at 89.35 (this marks a long-term level where the market has generally found some resistance and pulled back). As a result, both the weekly and daily charts reflect overbought conditions at the moment.
Shorter-term price action on the H1 timeframe reveals the crypto compressing between an ascending triangle (generally viewed as a continuation signal) taken from $35,157 and $33,000. Support to be aware of falls in at $33,081, with resistance seen overhead at $34,246 and $34,842.
Overall, favouring buyers is the clear uptrend, daily support from $34,048 and the ascending triangle formation on the H1. On the side of sellers, we have weekly resistance at $35,060, as well as overbought space being tested on the weekly and daily charts according to the RSI. Should H1 price close above the upper limit of the ascending triangle, this would help confirm upside interest and likely see the unit push for $36,000 and perhaps daily resistance at $36,361. Failure to complete the H1 ascending triangle and H1 price nudging beneath support at $33,081 could imply a move down to at least $32,000.
Therefore, according to the above chart studies, the H1 ascending triangle will be vital for determining price direction this week.
Charts: TradingView
DISCLAIMER:
The information contained in this material is intended for general advice only. It does not take into account your investment objectives, financial situation or particular needs. FP Markets has made every effort to ensure the accuracy of the information as at the date of publication. FP Markets does not give any warranty or representation as to the material. Examples included in this material are for illustrative purposes only. To the extent permitted by law, FP Markets and its employees shall not be liable for any loss or damage arising in any way (including by way of negligence) from or in connection with any information provided in or omitted from this material. Features of the FP Markets products including applicable fees and charges are outlined in the Product Disclosure Statements available from FP Markets website, www.fpmarkets.com and should be considered before deciding to deal in those products. Derivatives can be risky; losses can exceed your initial payment. FP Markets recommends that you seek independent advice. First Prudential Markets Pty Ltd trading as FP Markets ABN 16 112 600 281, Australian Financial Services License Number 286354.
 Your capital is at risk
  Your capital is at risk