Wednesday’s US Consumer Price Index data report, due to be released at 8.30 am Eastern Time, is the big news item of the coming week. Following Friday’s positive jobs report, all eyes are on the CPI number, with questions already being asked about whether the US economy is overheating and if the monetary policy will have to turn hawkish.
On Wednesday, whatever the number is, it’s likely to have a dramatic impact, not least on the US Dollar basket, which measures the greenback’s strength against the other major global currencies.
USD Basket Index and US CPI Data
The Dollar Index (DXY) stands out as the most direct way to play the event. If the inflation data reports price growth above analyst expectations, then the US Fed would be expected to speed up the introduction of interest rate rises and tapering of QE – all of which would be good for the value of USD. On the other hand, any hint that recent price inflation is as “transitory” as the US Federal Reserve maintains, and the dollar can be expected to fall in value. Working your way through a scenario that initially might appear to be something of a coin toss is helped by a quick scan of technical indicators.
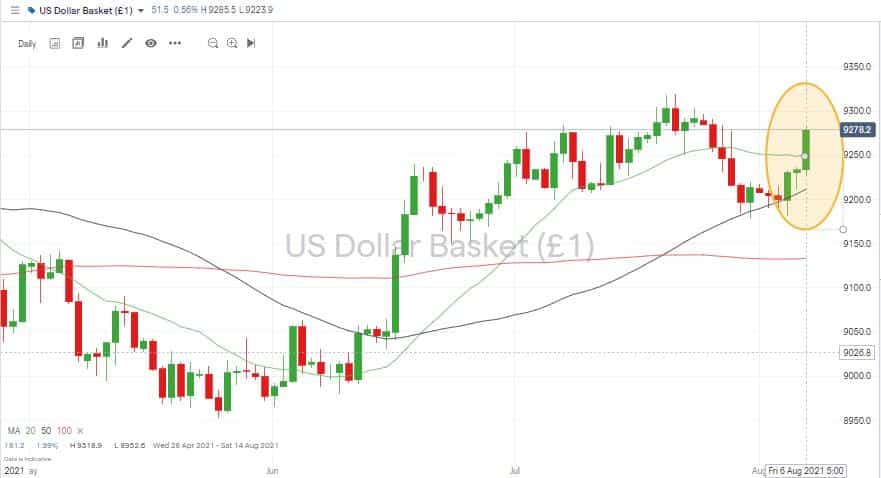
USD Basket Index – Daily Candles – Breakout?

Source: IG
USD Basket looks well-positioned to carry on its bullish momentum for the first part of the week. Friday’s big green candle took price through the 20 Daily SMA and brought the July high of 93.18 into play. A break of that level can’t be discounted. However, given price traded in a range between 91.50 – 93.18 since mid-June, there could be some further sideways price movement on the cards, particularly given the binary nature of Wednesday’s announcement.
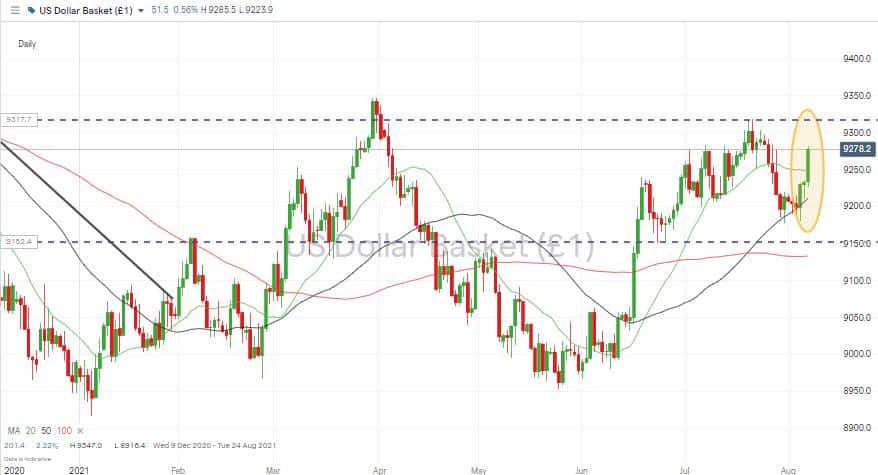
USD Basket Index – Daily Candles – Consolidation

Source: IG
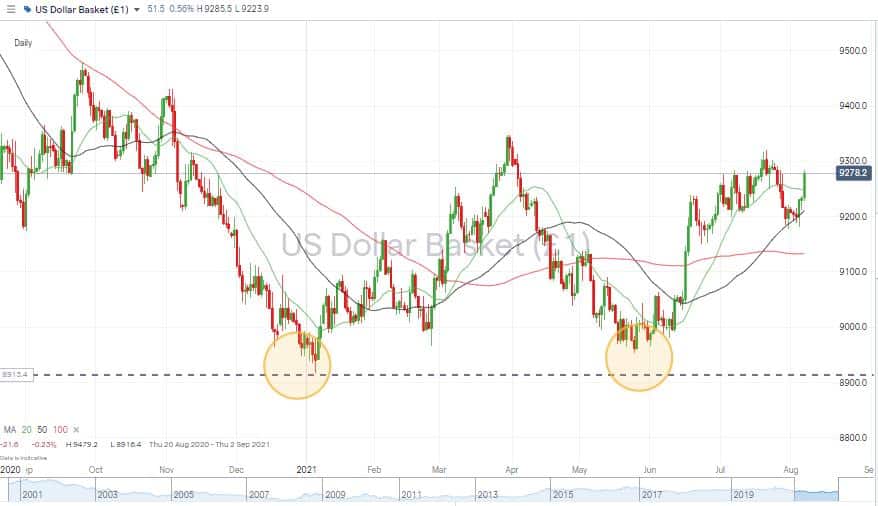
The next target for the bulls is the 93.47 March (and year to date) high). That’s a major resistance level and, if broken, would become a massive support for USD in the medium and long term. It marks the centre of a potential double-bottom pattern that started forming in November 2020.
USD Basket Index – Daily Candles – Double Bottom

Source: IG
With price currently trading above the 20, 50 and 100 Daily SMA’s, the path of least resistance looks to be to the upside. Analysts underestimated July’s number; the data released on July the 13th showed year-on-year CPI at a heart-stopping 5.4% compared to forecasts of 4.9%. Once bitten, twice shy. The consensus is that price inflation numbers released on Wednesday will be 5.3% year-on-year. Given that this prediction is already something of a record-breaker, an actual number that comes in above it would be head-turning. Put into context, the July the 13th number of 5.4% was the highest seen since 1991. Since then, energy and food prices have shown little sign of easing and continue to make up a large part of the US household budget.
If you want to know more about this topic, please contact us at [email protected]
 Between 74-89% of CFD traders lose
  Your capital is at risk
  Your capital is at risk
  Your capital is at risk