
If you had taken all other strategies off the table and just bought the dips in the Nasdaq over the last 10-years, you’d be sitting pretty in the performance tables. Thanks to the underlying strength of the tech sector and the kicker provided by Covid-19 changing lifestyle habits, investors who bought back in January 2010 are now sitting on total returns above 795%. The strategy hasn’t required much thought or demanded much resilience, and Wednesday’s sell-off in tech stocks is forming another sell-off which many will see as a dip to buy – with the only question being when?
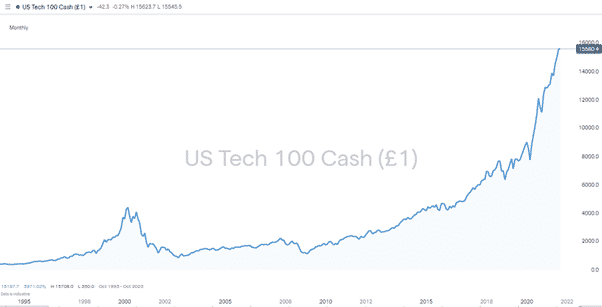
Source: IG
Long-term Trend-line Support
Those with a longer-term view, and more patience, may wait for the fabled September Effect to play out. Nothing can be guaranteed, but there is certainly a feeling in the markets that prices are a bit toppy after their 12 month-plus bull run. With a glance at the calendar and the disappointing historical performance of the ninth month of the year, it’s clear to see the jittery mood has come at a bad time.
- Supporting trend-line A is currently priced in the region of 14,800 and trend-line B at 14,100. Line B has been tested repeatedly, so from a purely technical perspective appears a stronger indicator than A, which had a starting point in the extraordinary market conditions of March 2020.
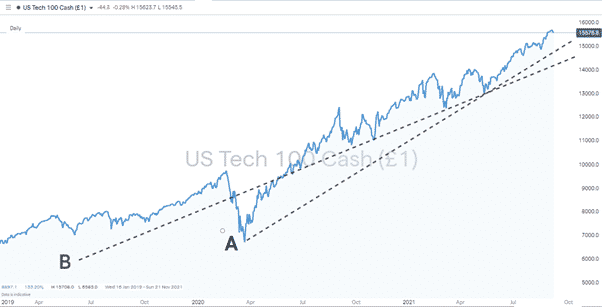
Source: IG
Long-term momentum doesn’t necessarily require long-term strategies to be applied for traders to make a return. Short-term traders using the 5-min and 1-hour charts may be looking to get into positions, but patience could be a virtue even on the shorter timeframes.
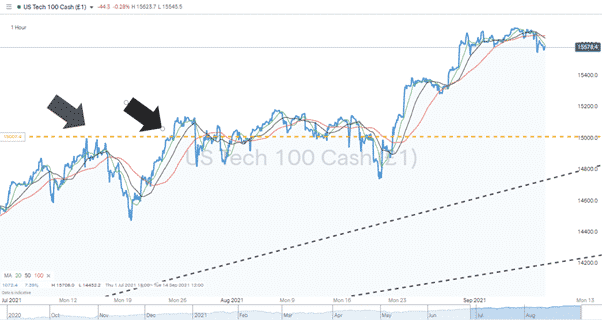
Source: IG
The Hourly SMA’s are all above the price level of Nasdaq futures on Thursday morning, and the intersection of the 100 SMA by both the 20 and 50 SMA on Wednesday is a pattern that can only be described as bearish.
Strong support is offered by the ‘big number’ psychologically important price level at 15,000, but that is some way off Thursday morning’s price level of 15,572. Given the effort taken to break through 15,000 when it was a resistance level, there is some hope for the bulls that it might hold if or when tested as a support. In August, the price consolidation lasted for almost two weeks (Monday the 12th and the 23rd of August) before price popped higher.
A retest of 15,000 looks hard to discount. Price action does have a habit of revisiting key support/resistance levels before carrying on its way.
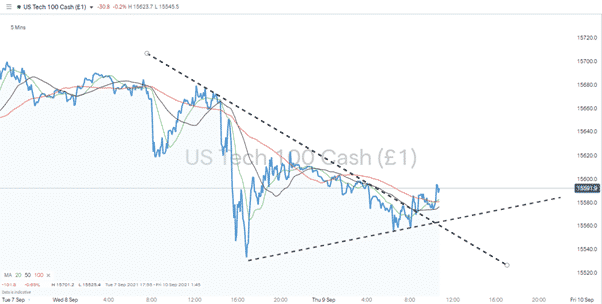
Source: IG
A trading signal to test in a Demo account is the break-out of a wedge pattern on the 5 min chart. It’s not a particularly well-confirmed signal but having a marker trade down generating virtual P&L could, for now, at least, be the optimal way of getting a feel for the market. Historical records point to Long Nasdaq being a winning trade, but for short-term traders, at least it might not be right now.
If you want to know more about this topic, please contact us at [email protected]
 Your capital is at risk
  Your capital is at risk