
Our trading signal analysis is based on a comprehensive summary of market data. We use a range of metrics with weighting given to simple and exponential moving averages and key technical indicators.
We created this Weekly Tips section to share possible trade entry and exit points based on technical analysis. We also have other methods to validate our trades which we can’t publicly share that help to increase their success. All our trades include entry and at least one target price. Stop losses are applied at the reader’s discretion. Our strategies typically trade with a wide stop loss, and risk is further mitigated by trading in small sizes.
Instrument | Price | Hourly | Daily |
EUR/USD | 1.1436 | Neutral | Strong Buy |
GBP/USD | 1.3547 | Buy | Strong Buy |
USD/JPY | 115.05 | Sell | Strong Buy |
S&P 500 | 4,495 | Neutral | Sell |
NASDAQ 100 | 14,683 | Sell | Sell |
FTSE100 | 7,547 | Neutral | Strong Buy |
Gold | 1,813 | Strong Buy | Neutral |
Crude Oil WTI | 90.26 | Sell | Strong Buy |
Bitcoin | 42,620 | Strong Buy | Buy |
Ethereum | 3,076 | Strong Buy | Buy |
UTC 09:52
FOCUS ON: Tech Stock Corporate Earnings Announcements
The coming week offers a trimmed down schedule in terms of news announcements. That could mean some of the trends which started at the end of last week are given time to develop. The price charts highlight how big data points, including central bank interest rate hikes and better than expected US jobs numbers, peppered the previous week’s trading.
Looking ahead, there could be a greater degree of price stability as those data reports are digested by investors. The most likely catalysts for any change continue to be the Q4 earnings announcements which are still feeding into the market. These have been sending whole sectors, particularly tech, spinning off in one direction or another.
Indices
Nasdaq 100
The hourly chart for last week highlights how the Nasdaq 100 index continues to pivot on the now key 14,425 price level, identified in the Trading Tips report of 31st January. This price point provided resistance in the week of 24th – 28th January and turned back five separate breakout attempts.
Monday 31st January was marked by price consolidating just above 14,425, and by the opening of the US markets, there was enough support for risk-on trading to take the index more than 3% higher by the end of the day’s trading session.
By Wednesday, the US tech index was up almost 6% on the week, but those buying into this finally being the end to the recent sell-off were caught out. Prices once again retreated on the back of hugely disappointing earnings reports from Facebook / Meta.
From a fundamental perspective, the question is whether Facebook is the odd-one-out. The risk for Mark Zuckerberg is that his suite of social media platforms is simply losing favour with consumers. FB shareholders are also concerned that this could be the case, and another tech giant Amazon offered an alternative investment opportunity one day later when it announced stunning earnings.
One important note is that although apparently driven by news announcements related to fundamental analysis strategies, the mid-week low-points from which price rebounded was still the 14,425 price level.
Nasdaq 100 Chart – 1hr Candles Up to 31st January – Five Failed Breakouts
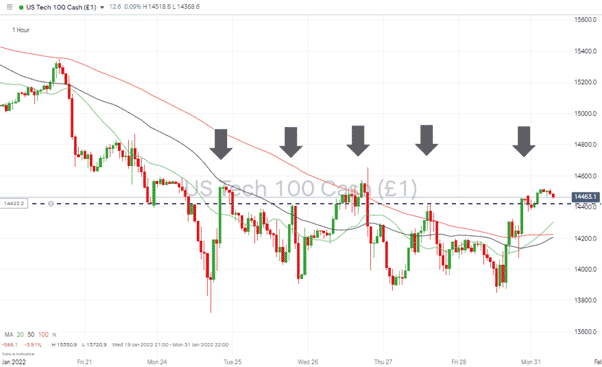
Source: IG
Nasdaq 100 Chart – 1hr Candles Up to 7th February – Resistance Now Providing Support
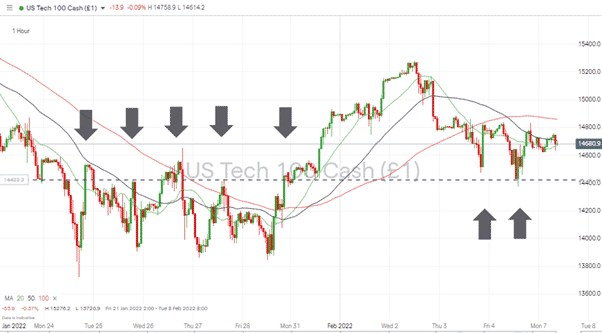
Source: IG
Short positions
- Entry Level 1: 14,425 – This price level acted as resistance and support over the last two weeks. A breakthrough to the downside would signal there is still more scope for downgrading tech stock valuations.
- Price Target 1: 14,383 – Price low of week of 4th October 2021. If price moves below this swing-low, it will create a bearish price pattern.
- Price Target 2: 13,757 – Current price of 20 SMA on Monthly chart
- Stop Loss: 14,736 – Current price of 20 SMA on Daily chart
Long positions
- Entry Level 1: 14,425 – Price used this level as support on Thursday 3rd and Friday 4th Feb. Trading near the level is now set to be associated with dip buyers entering the market.
- Price Target 1: 14,737 – Current price of 20 SMA on Daily chart
- Price Target 2: 15,276 – Price high of last week – printed on 2nd February.
- Stop Loss: < 14,379 – 23.6% Fibonacci retracement of the March 2020 bull run
S&P 500
Whilst price moves in the NASDAQ 100 and S&P 500 indices shadowed each other, the S&P 500 continues to show marginally more strength than the tech index. Further potential upside in the S&P could come about if price can break through the 50 SMA on the hourly price chart. That moving average has guided price downwards since the start of last Thursday’s trading session.
S&P 500 Hourly Chart – 27t January – 7th February – SMA Guiding Price
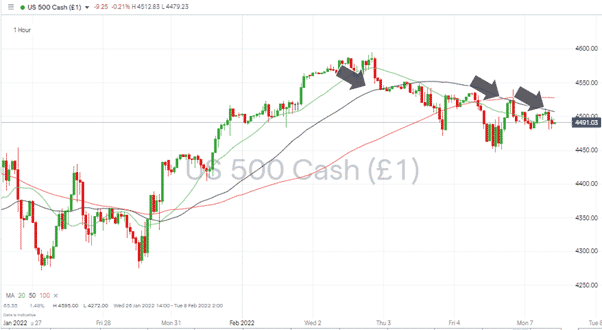
Source: IG
Short positions
- Entry Level 1: 4,507 – Current position of Hourly 50 SMA and close to the psychologically important round-number price level of 4,500.
- Price Target 1: 4,389 – Area of price resistance/support identified in the Trading Tips report of 31st January
- Price Target 2: 4,270 – Price low of week of 27th September 2021. If price moves below this swing-low, it will confirm a long-term bearish price pattern has been formed.
- Stop Loss: 4,618 and 4616– Current price of 50 and 100 SMAs on Daily chart
Long positions
- Entry Level 1: 4,389 – Using the resistance price level as a support indicator should price retreat to clip it.
- Price Target 1: 4,618 and 4616– Current price of 50 and 100 SMAs on Daily chart. With these two key metrics sitting so close to each other, any rally in the market would need considerable momentum to get past this resistance level at the first effort.
- Stop Loss: < 4,221 – January to date low and 23.6% Fibonacci Retracement from March 2020 price lows.
FTSE 100
The FTSE isn’t known for its tech stocks which makes the outlier, Ocado Group’s, full-year earnings release on Tuesday something to watch out for.
FTSE 100 Hourly Chart – Supporting Trend Line
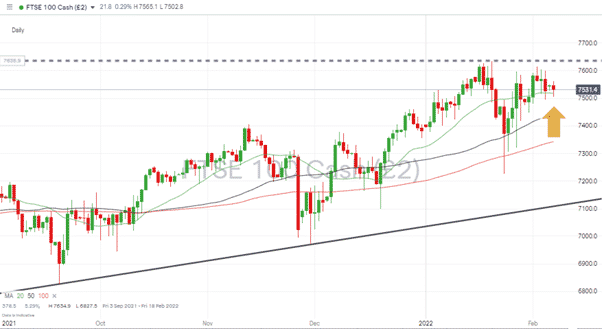
Source: IG
Long positions
- Entry Level 1: 7,626 – With price trading some way above the supporting trend line, those looking to work into long positions might do well to wait until the resistance level at 7,626 is confirmed to be broken.
- Price Target 1: 7,700 – If price can break through 7,626, then there are few resistance indicators in the way of further upwards momentum and investor fears would most likely be triggered by round-number price levels coming into play.
- Stop Loss: 7,439 – Current region of 50 SMA on Daily price chart.
- Stop Loss: 7,110 – Trend line support.
Forex
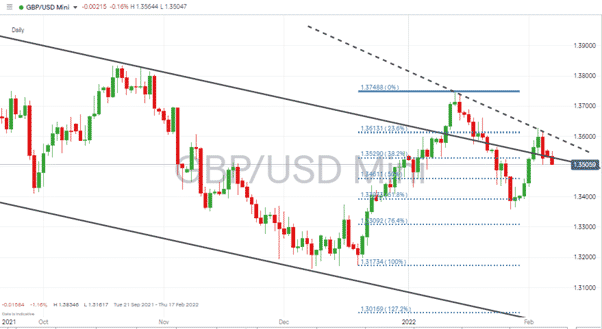
GBPUSD
As expected, the Bank of England increased the base lending rate by 0.25 percentage points. Notes from the meeting reveal that a rise of 0.50 percentage points was almost voted through, which led to sterling showing strength midweek. This was tempered by the markets factoring in strong jobs numbers out of the US, indicating that interest rates there appear to be heading in the same direction.
GBPUSD – Daily chart – Price trading along long-term downwards price resistance
Source: IG
Long positions
- Entry Level 1: 1.3525 – Current position of top of the downward trend line. A breakout strategy based on reports suggesting the UK economy is overheating.
- Price Target 1: 1.3628 – Price high of last week
- Price Target 2: 1.3748 – Year-to-date price high
- Stop Losses: 1.350 – Using the upper trend line of the long term downwards price channel and psychologically important 1.35 price level.
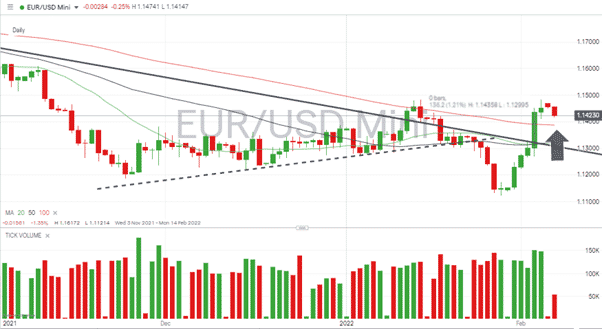
EURUSD
Thursday’s +1.2% price rise in EURUSD was associated with above-average trading volumes, suggesting that momentum could shift to the upside.
EURUSD – Daily chart – Buying Into A Breakout Strategy
Source: IG
Long positions
- Entry Level 1: 1.13868 – Using the current position of the 100 Daily SMA as a buying opportunity.
- Entry Level 2: 1.1359 – Buying into any EUR weakness in the region of the dotted trend line dating back to Dec 2021.
- Stop Losses: 1.130 –The upper trend line of the long term downwards price channel and psychologically important round-number price level.
EURUSD – Daily chart – Breakout Strategy
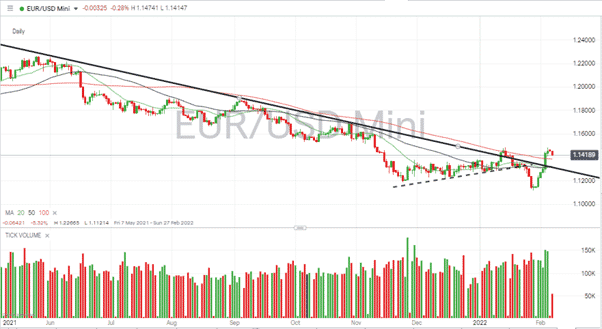
Source: IG
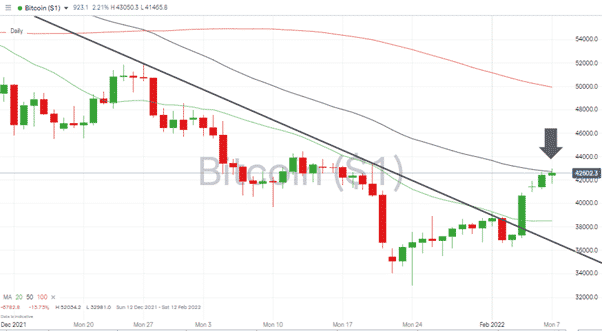
Crypto – Bitcoin & Ethereum
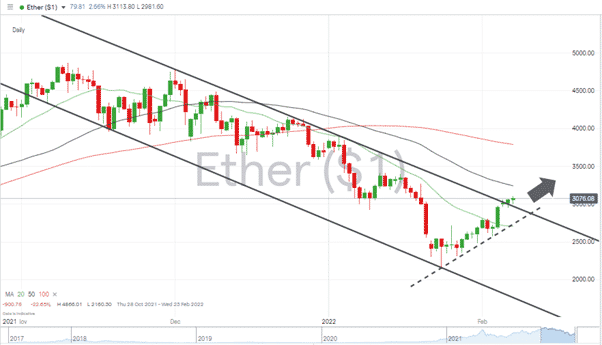
Both of the big crypto coins experienced a big price bounce last week, with Ethereum clocking gains of more than 20%. Whether this is a dead-cat bounce, or the start of the next rally is still up for debate.
Bitcoin – Daily price chart – Breakout Through Trend Line Resistance
Source: IG
Bitcoin Long positions
Entry Level: 42,714 – If the current upwards momentum takes price above the 50 SMA on the Daily price chart, then that opens the door to price rallying up to the psychologically important $50,000 price level
- Price Target 1: 50,000
- Stop Losses 1: < 36,000 Current region of the upper trend line of the long term downwards price channel
- Stop Losses 2: 32,981 – Price low of 24th January, also the year-to-date low.
Ethereum – 1D price chart – New Short-term Trend Line Holding & Breakout of Price Channel
Source: IG
Ethereum Long positions
- Entry Level: 3,243 – As with the Bitcoin breakout strategy. Using the 50 SMA on the Daily price chart as an indicator that upward momentum has been confirmed.
- Price Target 1: 3,790 – Current region of the 100 SMA on Daily price chart
- Stop Losses: > 3,000 Current region of the upper trend line of the long term downwards price channel and ‘big number’ price support
Risk Statement: Trading financial products carries a high risk to your capital, especially trading leverage products such as CFDs. They may not be suitable for everyone. Please make sure that you fully understand the risks. You should consider whether you can afford to take the risk of losing your money.

Forextraders' Broker of the Month
BlackBull Markets is a reliable and well-respected trading platform that provides its customers with high-quality access to a wide range of asset groups. The broker is headquartered in New Zealand which explains why it has flown under the radar for a few years but it is a great broker that is now building a global following. The BlackBull Markets site is intuitive and easy to use, making it an ideal choice for beginners.