
Our trading signal analysis is based on a comprehensive summary of market data. We use a range of metrics with weighting given to simple and exponential moving averages and key technical indicators.
We created this Weekly Tips section to share possible trade entry and exit points based on technical analysis. We also have other methods to validate our trades which we can’t publicly share that help to increase their success. All our trades include entry and at least one target price. Stop losses are applied at the reader’s discretion. Our strategies typically trade with a wide stop loss, and risk is further mitigated by trading in a small size.
Instrument | Price | Hourly | Daily |
EUR/USD | 1.1358 | Strong Buy | Neutral |
GBP/USD | 1.3630 | Strong Buy | Strong Buy |
USD/JPY | 114.85 | Strong Sell | Sell |
S&P 500 | 4,357 | Strong Sell | Strong Sell |
NASDAQ 100 | 14,009 | Strong Sell | Strong Sell |
FTSE100 | 7,544 | Neutral | Neutral |
Gold | 1,987 | Buy | Strong Buy |
Crude Oil WTI | 89.89 | Strong Sell | Neutral |
Bitcoin | 38,936 | Sell | Strong Sell |
Ethereum | 2,715 | Neutral | Strong Sell |
UTC 08:25
FOCUS ON: Sell The Rumour, Buy The Fact?
Geopolitical risk in the form of Russian intervention in Ukraine continues to weigh heavily on the markets. Last week all of the S&P 500, Nasdaq 100, FTSE 100, Crude oil, Bitcoin and Ethereum posted falls in value; both cryptos gave up more than 5%, and the Nasdaq posted a -1.72% return.
Although the catalyst for the sell-off is based on principles of fundamental analysis, technical analysis patterns are still holding and giving indications of the next move. The question being asked is whether all the bad news about a potential conflict in Eastern European is already priced in.
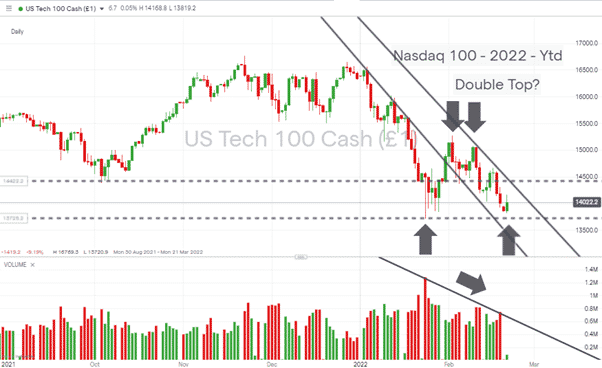
Taking the Nasdaq 100s down day of 24th January as the starting point of the recent bout of price weakness, it’s possible to see trade volumes have fallen throughout the period. Whilst prices have remained soft, bullish candles with corresponding high trade volumes could signal the capitulation of the bears – is it time to sell the rumour and buy the fact?
The Weekly Trading Tips Report of 14th February correctly weighted its analysis to further downside momentum but this week introduces entry points for those looking to buy the dip.
NASDAQ 100 1DAY Price Chart – Continued sell-off but lower trade volumes.
Source: IG
Indices
NASDAQ 100
The Double-Top price pattern identified in this report was confirmed on Thursday and Friday of last week when in the space of two days, the Nasdaq gave up 3.96% of its value and drove price down to as low as 13,916.
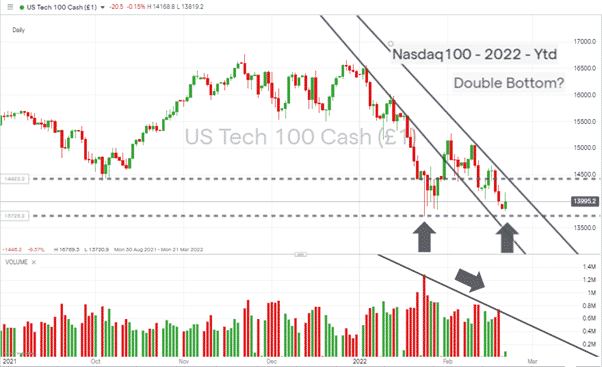
Nasdaq 100 Chart – 1Day Candles Up to 2022 year-to-date – Double Bottom?
Source: IG
The critical support level 13,720 is now in clear view, but a bounce off that year-to-date low can’t be dismissed mainly due to the bearish price action being associated with lower trading volumes. Do the bears have the heart and the momentum to push price to new YTD lows, given that the index is already 14.37% down on the year?
Long positions
- Entry Level 1: 13,720 – A rebound strategy based on the potential for the market being oversold, at least on a short-term basis. The two downward trendlines have the same gradient, which points to the move away from methodical and long-running risk. The Russia-Ukraine crisis is causing concern, but other traders appear to be lightening positions in tech stocks on the back of the sector being seen as overvalued.
- Price Target 1: 14,039 – Price low of Monday 14th February.
- Price Target 2: 15,276 – Month to date high printed on Wednesday 1st February
- Stop Loss: < 13,720 – key price support level. Year-to-date low price level.
Short positions
- Entry Level 1: 13,720 – A breakout strategy looking to capitalise on any further price weakness. Trade volumes would be a key metric to monitor, and signs that the bears are running out of steam might make this a trade to watch rather than buy into in any size.
- Stop Loss: > 14,039 – Price low of Monday 14th February
FTSE 100
The UK’s benchmark index continues to hold up better than the Nasdaq100 and S&P500 thanks to the number of oil and gas stocks that are constituent members. The FTSE 100 was down 0.58% last week compared with the Nasdaq’s 1.72% fall and the S&P’s 1.45% slump in value.
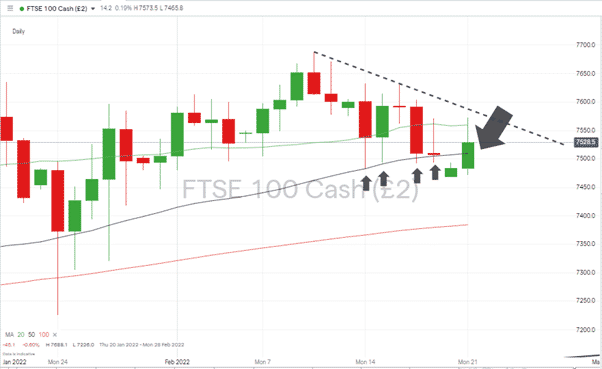
On Monday, Tuesday, Thursday, and Friday of last week, the FTSE 100 tested the support offered by the 50 SMA on the Daily price chart. An early morning breach of that level on the morning of 21st February was followed by price climbing back to trade above 7,509.
News that the government is scaling back Covid restrictions and that the UK is going to ‘learn to live with Covid’ has reduced the risk of further lockdowns impacting the UK economy. That can be expected to offer stock prices support.
FTSE 100 Daily Price Chart – Moving Average Offering Support
Source: IG
Long positions
- Entry Level 1: 7,509 – Region of the 50 SMA on the Daily price chart.
- Price Target 1: 7,580 – Region of downward trendline dating back to 10th February. After all the excitement of the last two weeks, it looks like a consolidatory wedge pattern could be forming, which would result in that line offering significant resistance.
- Stop Loss: < 7,467 – intraday price low of FTSE futures printed on 20th February.
Forex
GBPUSD
Suggestions that the Bank of England is looking to accelerate its interest rate rise programme supported cable prices through the last week. US rates are also due to head north, but dealing desks take the view that the UK bank will lead the charge.
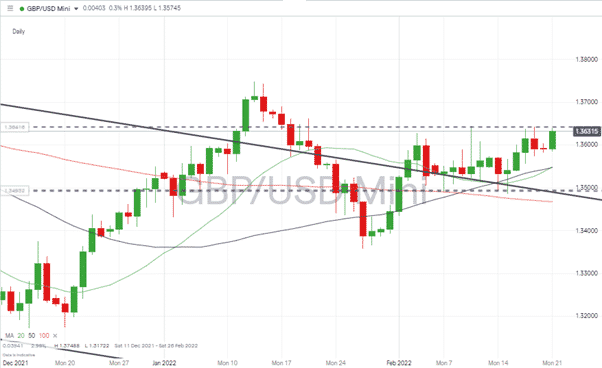
The resistance price level of 1.3643 could test the upward movement. That price level being in the region of the price highs of 3rd, 10th, 17th and 18th February.
GBPUSD – Daily chart – Interest Rate Driven Price Strength Nearing Resistance Level
Source: IG
Long positions
- Entry Level 1: 1.3643 – With price currently at 1.3631, fans of GBPUSD may want to wait for a breakout above 1.3643 to occur before stepping in.
- Price Target 1: 1.3714 – Region of 50 SMA on Weekly price chart.
- Price Target 2: 1.3748 – Year to date price high printed on 13th January.
- Stop Losses: < 1.3643 – Trend line resistance and upper end of potential sideways price channel.
Short positions
- Entry Level 1: 1.3643 – Selling into resistance formed by the upper end of the price channel and in the expectation of a period of sideways price action.
- Price Target 1: 1.3486 – Bottom of sideways trading range marked by price lows of 7th, 14th, and 15th February.
- Stop Losses: > 1.3643 – Trend line resistance and upper end of potential sideways price channel.
EURUSD
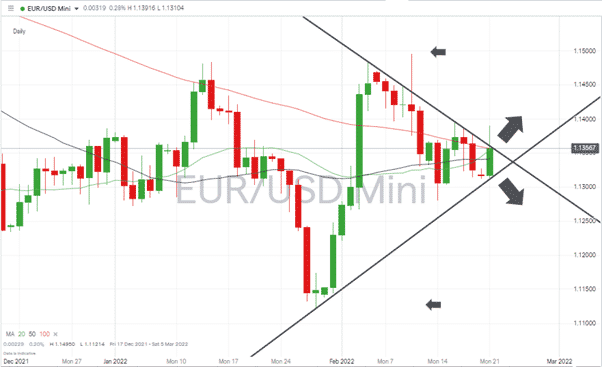
Covid concerns for eurozone countries still run stronger than in the UK. That resulted in EURUSD making a gain of 0.12% over the past week whilst GBPUSD put on 0.70% in value. A multi-week wedge pattern is forming, and without a high-volume breakout of the pattern, it could be a relatively quiet week for the EURUSD currency pair.
EURUSD – Daily chart – Wedge Pattern Forming – Price Consolidation?
Source: IG
Long positions
- Entry Level 1: 1.1358 – Using the upper trend line of the forming wedge pattern as a marker for any potential breakout to the upside.
- Target price: 1.14950 – Price high of 10th February. This price level marks peak euro strength during February and the year-to-date high.
- Stop Losses: < 1.1300 – The supporting trend line at the bottom of the wedge pattern currently sits at 1.1309. The psychologically important ’round number’ price level of 1.13 could also be expected to come into play.
Short positions
- Entry Level 1: 1.1300 Region of supporting trend line and ’round number’ price level.
- Target price: 1.1121 – The EURUSD wedge pattern break out strategy has a similar amount of room to the downside as it does should price break upwards. 1.1121 marks the year-to-date price low printed on 28th January.
- Stop Losses: > 1.1358 – Upper trend line of the wedge pattern.
Crypto – Bitcoin & Ethereum
Bitcoin and Ethereum posted negative weeks and dashed the hopes of traders who had factored in February’s price consolidation as a foundation for further upward movement. Ether has underperformed BTC for some time, but last week’s trading saw ETH lose 5.30% in value compared to Bitcoin’s 7.63%
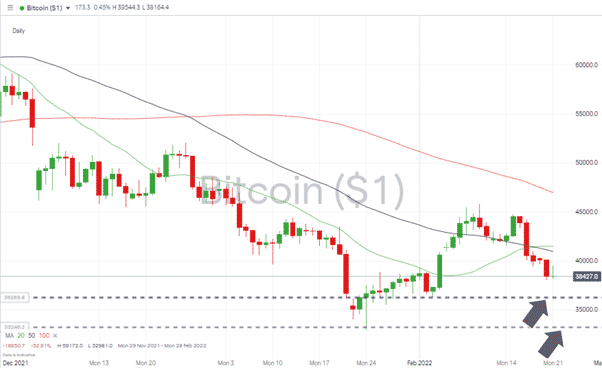
Bitcoin – Daily price chart – Key Support Levels Coming Into Play
Source: IG
Bitcoin Long positions
The February month-to-date low of 36,269 printed on 3rd February looks like it could be soon tested. Any move through there would bring the year-to-date low of 32,981, printed on 24th January, into play.
- Entry Level 1: 36,269 – February month to date low.
- Entry Level 2: 32,981 – Year-to-date low.
- Price Target 1: 45,822 – High of 10th February.
- Price Target 2: 50,000 – ’round number’ resistance.
- Stop Losses 1: < 32,981
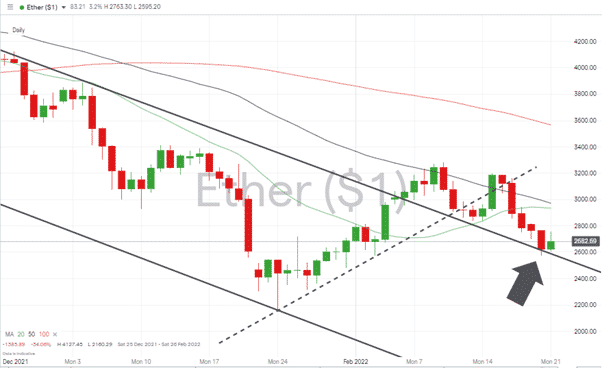
Ethereum – 1D price chart –Long-term Trend Line Breakout Still Holds
Source: IG
Ethereum Long positions
- Entry Level: 2,540 – Using the downward trend line as a guide to trade entry point. How ETH has followed but failed to fall past that trend line offers some hope to fans of the coin.
- Price Target 1: 3,188 – Price high of Wednesday 16th February.
- Stop Losses: < 2,540 Region of the downward trend line. A return to trading below this line would signal the capitulation of the upwards breakout of 5th February.
Risk Statement: Trading financial products carries a high risk to your capital, especially trading leverage products such as CFDs. They may not be suitable for everyone. Please make sure that you fully understand the risks. You should consider whether you can afford to take the risk of losing your money.

Forextraders' Broker of the Month
BlackBull Markets is a reliable and well-respected trading platform that provides its customers with high-quality access to a wide range of asset groups. The broker is headquartered in New Zealand which explains why it has flown under the radar for a few years but it is a great broker that is now building a global following. The BlackBull Markets site is intuitive and easy to use, making it an ideal choice for beginners.