
Our trading signal analysis is based on a comprehensive summary of market data. We use a range of metrics with weighting given to simple and exponential moving averages and key technical indicators.
We created this Weekly Tips section to share possible trade entry and exit points based on technical analysis. We also have other methods to validate our trades which we can’t publicly share that help to increase their success. All our trades include entry and at least one target price. Stop losses are applied at a reader’s discretion. Our strategies typically trade with a wide stop loss, and risk is further mitigated by trading in a small size.
Instrument | Price | Hourly | Daily |
EUR/USD | 1.1358 | Strong Buy | Neutral |
GBP/USD | 1.3630 | Strong Buy | Strong Buy |
USD/JPY | 114.85 | Strong Sell | Sell |
S&P 500 | 4,357 | Strong Sell | Strong Sell |
NASDAQ 100 | 14,009 | Strong Sell | Strong Sell |
FTSE100 | 7,544 | Neutral | Neutral |
Gold | 1,897 | Buy | Strong Buy |
Crude Oil WTI | 89.89 | Strong Sell | Neutral |
Bitcoin | 38,936 | Sell | Strong Sell |
Ethereum | 2,715 | Neutral | Strong Sell |
UTC 09:25
FOCUS ON: Extreme Short-term Price Volatility
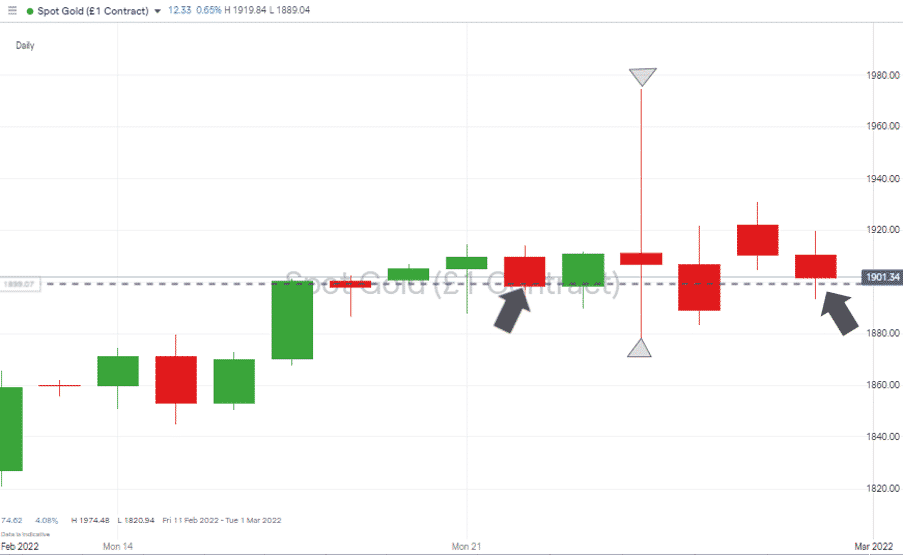
After a week quite like no other, some markets have opened the week of 28th February almost unchanged from where they were on February 21st. Gold, trading at 1,897, is bang in line with where it was trading a week ago.
This masks the extreme price volatility caused by the invasion of Ukraine by Russia. On Friday, gold posted a 5.2% trading range in a single trading session.
Gold – Daily Price Chart – Extreme intraday volatility but stable on a daily basis
Source: IG
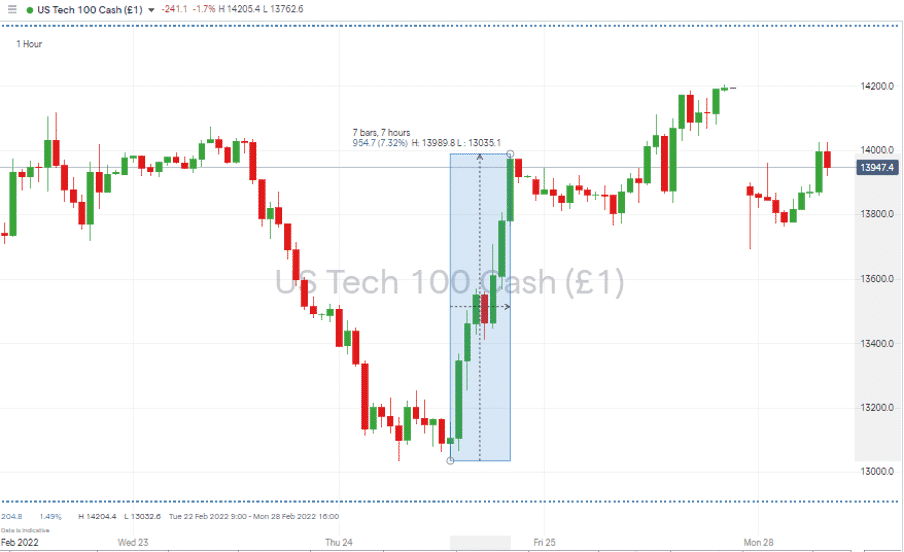
The Nasdaq 100 index, which by Thursday 24th February was reporting an almost 6% loss on the week, rallied hard enough that by Friday’s close of markets, it had posted a 2.46% weekly gain.
The Weekly Trading Tips Report of 21st February weighted its analysis towards opportunities to buy the dips. Patience and nerves of steel would have been required to optimise returns, but the staggering rally in the Nasdaq from 13,035 at midday Thursday, to 13,989 just eight hours later was a 7.32% increase in value.
That price surge has been attributed to investors fleeing international markets and buying into the relative security of US-listed shares. It could also have been the market being ‘oversold’ on a short term basis, and RSI indicators did prove to be one of the ‘go-to’ trading tools of last week.
Establishing the exact cause of the dramatic swing will prove challenging, but the reversal like upward and downward price moves raises many questions. Stock markets are usually associated with the price rising steadily over a long-term period, with infrequent price dips which are short-lived but relatively extreme. This reflects the sense of panic and increased selling that can happen when the market mood turns bearish.
Since the beginning of January, the trend in equity indices has been flipped on its head. The DJIA, S&P 500 and Nasdaq indices have experienced a steady lowering of price, with the price rises being the times of increased drama in the market.
NASDAQ 100 1HR Price Chart – Rallies proving harder and faster than sell-offs
Source: IG
The chance of a return to ‘normality’ comes on Friday 4th when the US Labor Department releases the February jobs data, in the form of the Non-farm Payrolls report.
Indices
NASDAQ 100
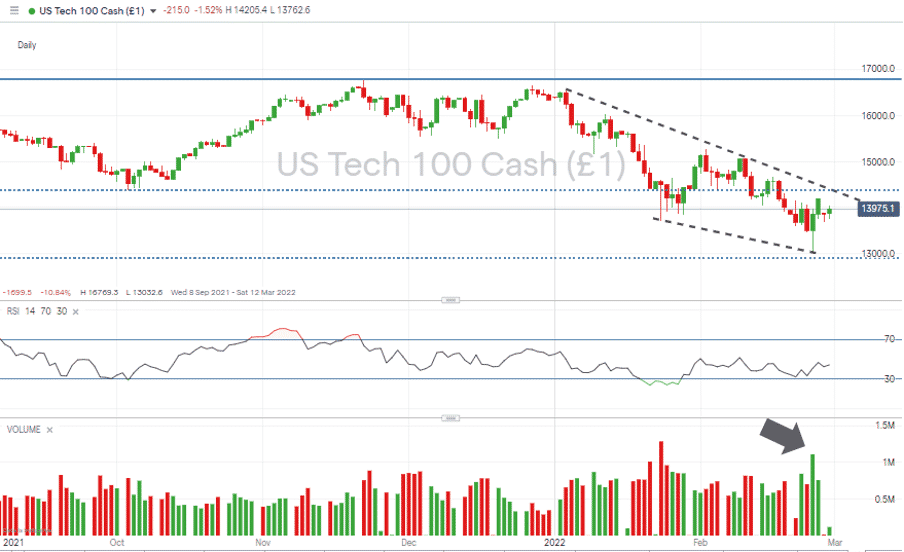
On the daily charts, price action continues to form bearish patterns. Despite several short-term displays of bullish sentiment, the downward channel is holding its shape. A break to the upper resistance trend line could signal a chance to get into a long-term breakout strategy, but until that occurs, bulls might do well to approach the market with caution.
Nasdaq 100 Chart – 1Day Candles – Downward channel still holding
Source: IG
Could the Nasdaq break below 13,000? Thursday’s low of 13,032 was a passing shot at the psychologically important price level, and that session also recorded the second-highest trading volumes of the year. With the price rebounding to 13,987 by Monday morning, and the Daily RSI sitting at 44, it would take considerable effort from the bears to test it again shortly.
Long positions
- Entry Level 1: 13,781 – 13,813 – Region of the 50 and 100 SMAs on the hourly price chart.
- Entry Level 2: 14,373 – A breakout strategy in the region of the downward trend line, which has been acting as resistance since 1st January. 14,389 also marks the 23.6% Fib retracement level of the bull-run, which started in March 2020.
- Price Target 1: 14,814 – Region of 50 SMA on Daily chart
- Price Target 2: 15,276 – Month to date high for February and one of the tops of the double-top formation discussed here.
- Stop Loss: < 13,506 – Lowest closing price of February recorded on 23rd February.
FTSE 100
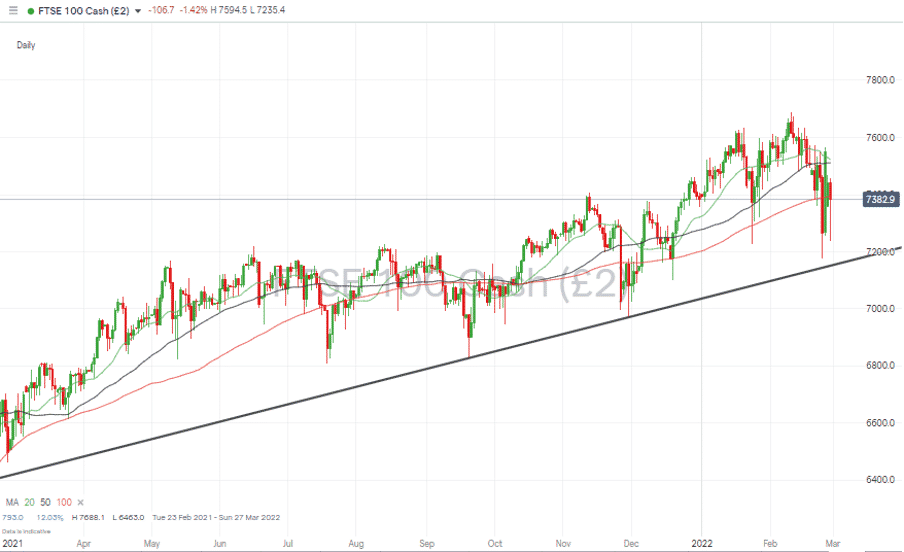
The FTSE lagged the US markets last week as global investors headed for the security of North American stocks and the chance to hold assets denominated in USD. The FTSE 100 was down 1.80% last week compared with the S&P’s 1.08% slump in value and the Nasdaq 100 breaking even.
Oil and gas stocks make up a considerable percentage of the FTSE, but BP and Shell were seen as being too embroiled in the Russian energy sector to benefit from crude at one point trading above the $100 per barrel mark.
FTSE 100 Daily Price Chart – Trend Line Support
Source: IG
Long positions
- Entry Level 1: 7,393 – Region of the 100 SMA on the Daily price chart.
- Price Target 1: 7,510 – 7,522 – Region of 20 and 50 SMAs on Daily chart. The two key averages are converging and likely to provide stiff resistance if the price reaches this point.
- Stop Loss: < 7,150 – region of supporting trend line which dates back to September 2021.
Forex
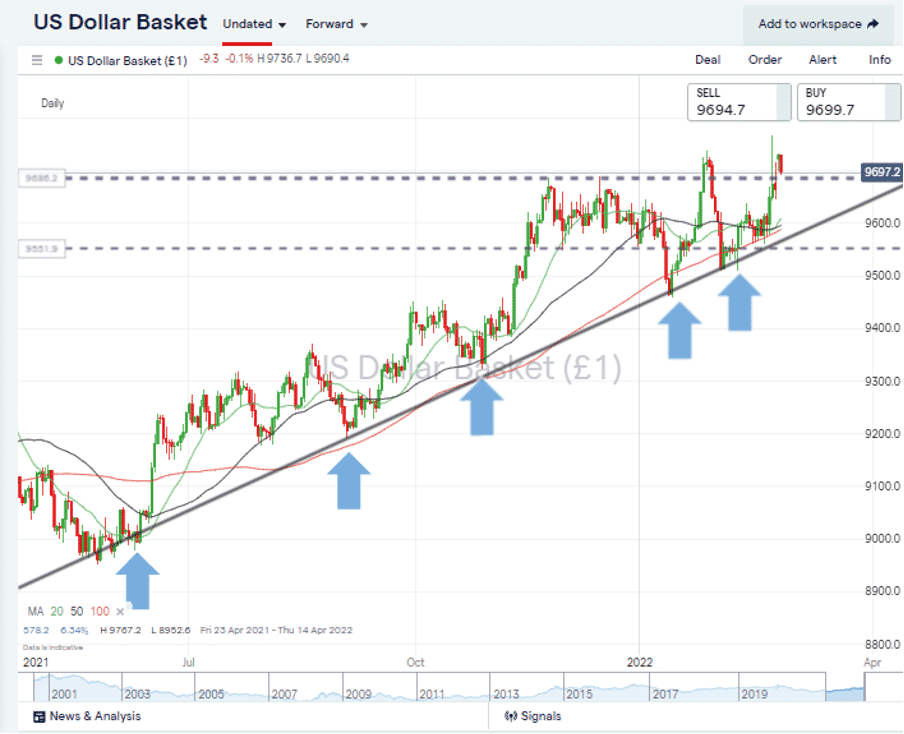
The dash to buy US assets such as bonds and stocks needed to be financed by an equally large shift into USD. The US Dollar Basket index reached as high as 9,767 on Thursday 24th, and the path of least resistance for the greenback continues to be upwards.
USD Basket Index – Daily chart – Long-term supporting trend line
Source: IG
The Non-farm payroll numbers due on Friday could be expected to provide a momentary distraction from the Ukraine conflict with investors likely to be reminded that levels of wage inflation will play a big part in the US Fed’s decisions regarding interest rate policy.
GBPUSD
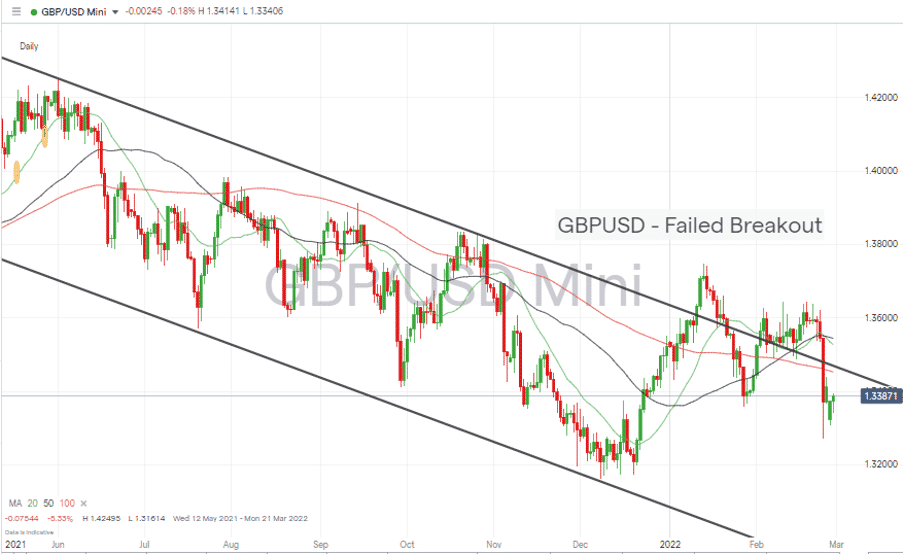
GBPUSD – Daily chart – Interest Rate Driven Price Strength Nearing Resistance Level
Source: IG
Long positions
- Entry Level 1: 1.3454 – With the price currently at 1.3383, fans of GBPUSD may want to wait for a breakout above the upper limit of the downwards channel before stepping in.
- Price Target 1: 1.3748 – Year to date price high printed on 13th January.
- Stop Losses: < 1.3161 – Low of 8th December 2021.
Short positions
- Entry Level 1: 1.3454 – Selling into strength and using the resistance formed by the upper end of the price channel.
- Price Target 1: 1.3272 – Year to date price low, printed on 24th February.
- Stop Losses: > 1.3603 – High of 17th February.
EURUSD
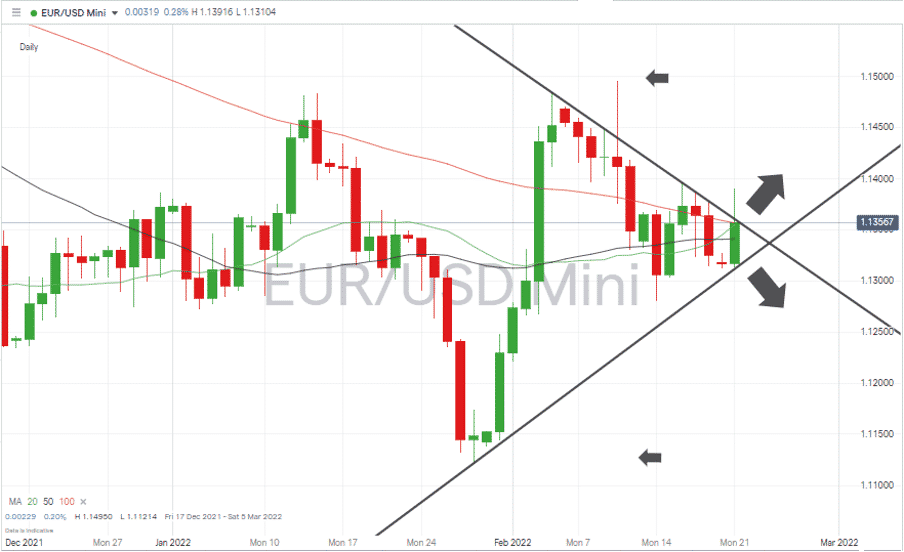
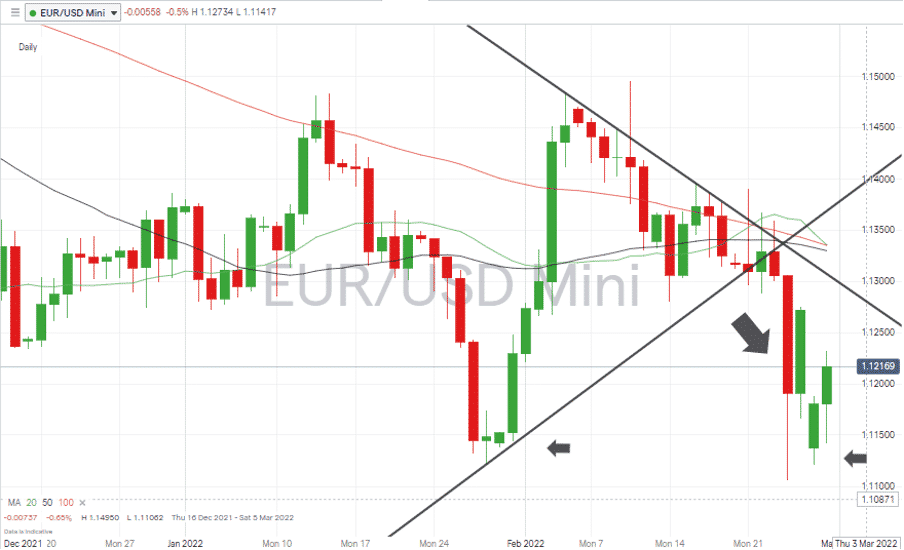
EURUSD tumbled out of the sideways wedge pattern which it had been forming for several weeks. Further downwards movement following the downward trend line appears likely, but with the low of 1.1121 recorded on 28th January offering potential support.
EURUSD – Daily chart – Wedge Pattern Forming – Before
Source: IG
EURUSD – Daily chart – Wedge Pattern Forming – After
Source: IG
Short positions
- Entry Level 1: 1.130 Region of downwards trend line and ‘round number’ price level.
- Target price: 1.1121 – Marks the year-to-date price low printed on 28th January and already proved able to offer support during last week’s sell-off.
- Stop Losses: > 1.13296 – Region of 100, 50 and 20 SMAs on the Daily chart.
Crypto – Bitcoin & Ethereum
The idea that cryptos might be seen as a safe-haven asset hasn’t taken off during the Ukraine-Russia conflict. Another concept that failed to fly was that crypto would be the go-to method for those looking to wire assets into and out of the war zone. The price of both Bitcoin and Ethereum have instead consolidated.
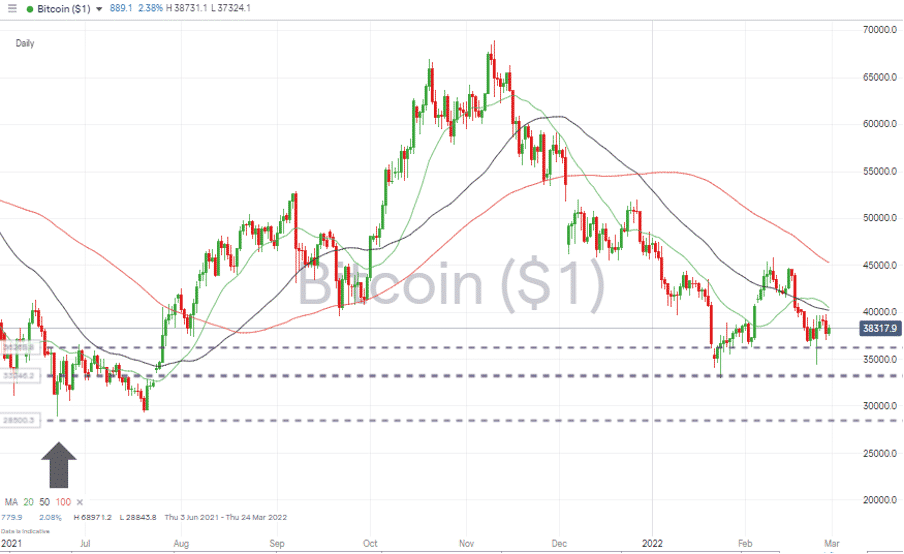
Bitcoin – Daily price chart – Test and Rebound off 36,269
Source: IG
Bitcoin Long positions
The month-to-date low of 36,269 printed on 3rd February was tested on Thursday 24th but held. Any move through there would bring the year-to-date low of 32,981, printed on 24th January into play, but for now, the bulls can take comfort from the rapid rebound from that level.
- Entry Level 1: 36,369 – Price low of 22nd February.
- Price Target 1: 45,822 – High of 10th February.
- Price Target 2: 50,000 – ‘round number’ resistance.
- Stop Losses 1: < 32,981
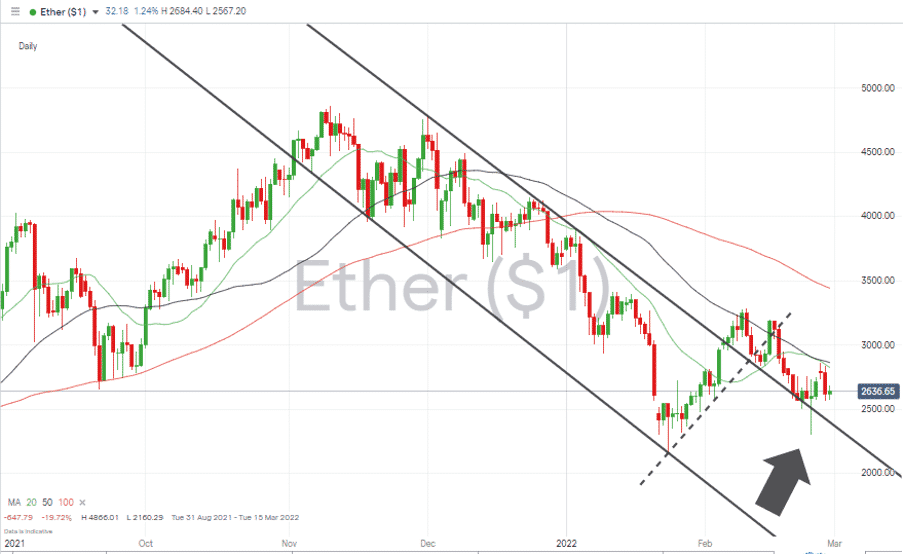
Ethereum – 1D price chart –Long-term Trend Line Breakout Still Holds
Source: IG
Ethereum Long positions
- Entry Level: 2,366 – Using the downward trend line as a guide to trading entry point. How ETH has followed but failed to close below that downwards trend line offers some hope to fans of the coin.
- Price Target 1: 3,188 – Price high of Wednesday 16th February.
- Stop Losses: < 2,302 Price low of 24th February. A tight stop loss that might suit those looking to enter a speculative position in small size.
Risk Statement: Trading financial products carry a high risk to your capital, especially trading leveraged products such as CFDs. They may not be suitable for everyone. Please make sure that you fully understand the risks. You should consider whether you can afford to take the risk of losing your money.

Forextraders' Broker of the Month
BlackBull Markets is a reliable and well-respected trading platform that provides its customers with high-quality access to a wide range of asset groups. The broker is headquartered in New Zealand which explains why it has flown under the radar for a few years but it is a great broker that is now building a global following. The BlackBull Markets site is intuitive and easy to use, making it an ideal choice for beginners.