
Instrument | Price | Hourly | Daily |
EUR/USD | 1.0718 | Strong Sell | Strong Sell |
GBP/USD | 1.2742 | Strong Sell | Strong Sell |
USD/JPY | 128.27 | Strong Sell | Strong Buy |
S&P 500 | 4,239 | Strong Sell | Strong Sell |
NASDAQ 100 | 13,269 | Strong Sell | Strong Sell |
FTSE100 | 7,410 | Strong Sell | Neutral |
Gold | 1,914 | Strong Sell | Strong Sell |
Crude Oil WTI | 98.07 | Strong Sell | Strong Sell |
Bitcoin | 38,870 | Strong Sell | Strong Sell |
Ethereum | 2,835 | Strong Sell | Strong Sell |
UTC 08:34
Our trading signal analysis is based on a comprehensive summary of market data. We use a range of metrics with weighting given to simple and exponential moving averages and key technical indicators.
We created this Weekly Tips section to share possible trade entry and exit points based on our technical analysis. We also have other methods to validate our trades which we can’t publicly share that help to increase their success. All our trades include entry and at least one target price. Stop losses are applied at the reader’s discretion. Our strategies typically trade with a wide stop loss, and risk is further mitigated by trading in small sizes.
The FTSE 100 equity index, the euro-dollar currency pair, and crypto market indicators point towards short-term strength and long-term weakness. Trading decisions need to be made with holding periods in mind, and choppy market conditions could prevail in the run-up to the Fed’s big announcement.
FOCUS ON: Markets at a Crossroads as a Busy News Week Kicks Off
Risk-on assets posted another down week last week, with the most bruising price falls in the closing moments. The NASDAQ 100 gave up 6.76% in value during the trading sessions of Thursday and Friday and was still haemorrhaging value right up to Friday’s closing bell. In forex markets, GBPUSD was down 1.63%.
The weekly matrix of technical indicators has unsurprisingly moved to ‘Strong Sell’ mode with major stock indices. GBPUSD, EURUSD, oil, and cryptos are all pointing to further downward price moves hourly and daily.
Downward pressure on gold (Strong Sell) raises some questions. The metal’s role as a haven is supposed to make it attractive to investors during times of uncertainty. This could be a ‘dash to cash’, with big players selling out of everything. Still, it looks more likely to be caused by comments from the US Federal Reserve about interest rate policy and its more hawkish tone than previously expected.
Whichever way you look at the comments of Fed Chair Jerome Powell, it’s hard not to feel that more aggressive interest rate rises are on the way. Whilst speaking as part of an International Monetary Fund panel on Thursday, he said:
“It’s absolutely essential to restore price stability.”
He continued:
“It is appropriate in my view to be moving a little more quickly… I also think there is something to be said for front-end loading any accommodation one thinks is appropriate… I would say 50 basis points will be on the table for the May meeting.”
Source: CNBC
Powell’s comments have boosted price volatility just as the markets head into one of the busiest news weeks of the year. The US is set to release Q1 GDP figures on Thursday and follow those up with Non-Farm Payroll job numbers on Friday. The Bank of Japan will make its interest rate announcement on Thursday. The rest of the week is peppered with corporate earnings announcements from market movers such as Alphabet, Apple, Microsoft, and Chevron.
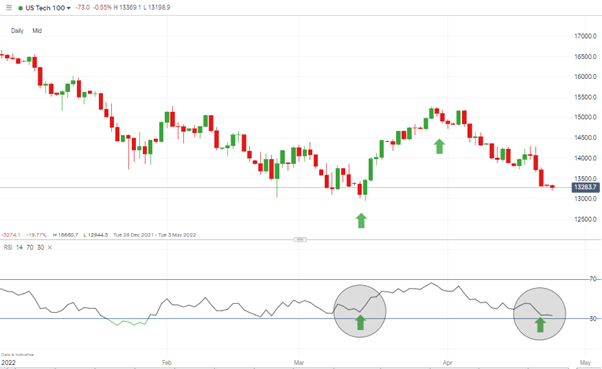
In a week when the health of the global consumer will be thoroughly tested, the Strong Sell signals will be tempting many to move into short positions; however, one word of caution is that this is beginning to look like a moment of market capitulation. Bulls will be ready to pounce on any upbeat news announcements. The last time the RSI on the NASDAQ 100 Daily Price Chart reached these levels (13th March), the index then rallied by 16.89% in two weeks.
Nasdaq 100 Chart – 1Day Candles – RSI at 33.6
Indices
NASDAQ 100
Netflix’s horrible earnings report wiped 30% off the share price of the streaming service last week so that all eyes will be on the updates provided this week. Alphabet kicks off the release of the numbers on Tuesday, Spotify follows on Wednesday, and Twitter, Apple, and Amazon all report on Thursday.
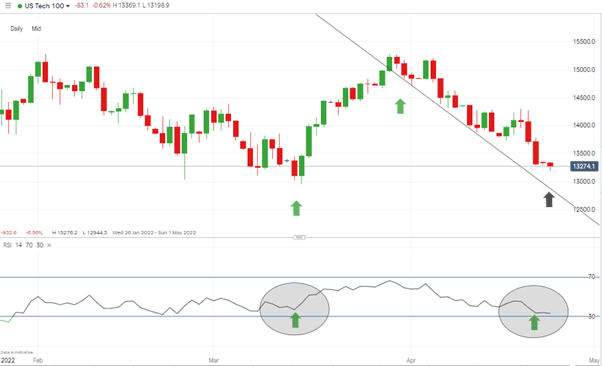
With the RSI trading at 33, there is potential for a bounce, even a dead-cat one. The downward supporting trendline is also coming into play. Apple, in particular, has a habit of beating analyst expectations, so good news for the largest stock in the world could also act as a catalyst for upward price movement.
A break of the downwards trendline would offer hope to the bulls, and with Netflix and IBM releasing Q1 earnings reports on Tuesday, there are potential catalysts in play for those looking to go long.
NASDAQ 100 Chart – 1Day Candles – Supporting Trendline and RSI
Source: IG
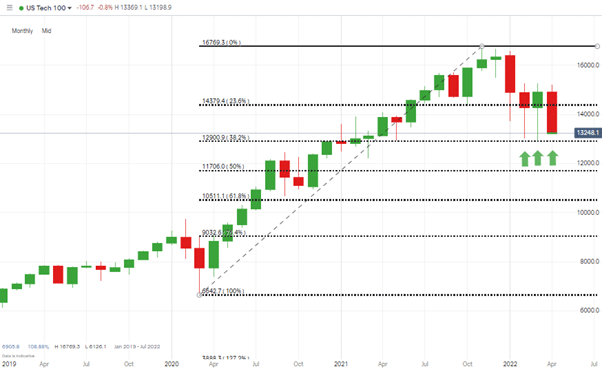
Long positions
- Entry Level 1: 12,944 – Year-to-date price low recorded in March.
- Entry Level 2: 12,900 – 38.2% Fib retracement from March 2020 bull run. Has previously provided support and marks lows of February and March 2020.
- Price Target 1: 15,201 – April month-to-date high
- Stop Loss: < 12,900 – Intraday price low of 18th April 2022.
NASDAQ 100 Chart – Monthly Candles – Supporting Trendline and RSI
Source: IG
Short positions
- Entry Level 1: 13,377 – Region of the 20 SMA on the Hourly Price Chart.
- Price Target 1: 12,944 – Year to date price low.
- Price Target 2: 12,900 – Fib support from March 2020 bull run.
- Stop Loss: > 13,664 – Region of 50 SMA on Hourly Price Chart.
FTSE 100
The FTSE 100 has spent the first part of the week catching up on the after-hours price crash in the US on Friday. The index has, over recent weeks, been outperforming other equity benchmarks thanks to the defensive nature of some of the stocks it contains. That could mean that the recent price drop represents a pullback, and any spike in the price of crude can be expected to support the FTSE, which contains big oil names such as BP and Royal Dutch Shell.
FTSE 100 Daily Price Chart – Approaching Fib Support Level at 7323
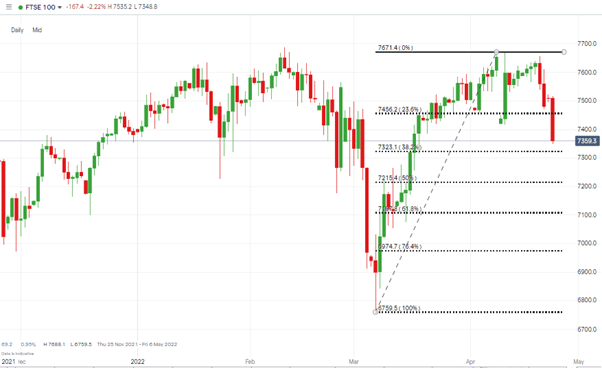
Source: IG
Long positions
- Entry Level 1: 7,323 – 38.26% Fibonacci Retracement level from the bullish price rise, which started on 7th March 2022.
- Price Target 2: 7,688 – Year-to-date high recorded in February 2022.
- Price Target 1: 7,418 – Region of the 50 SMA on the Daily Price Chart.
- Stop Loss: < 7,215 – 50% Fibonacci support.
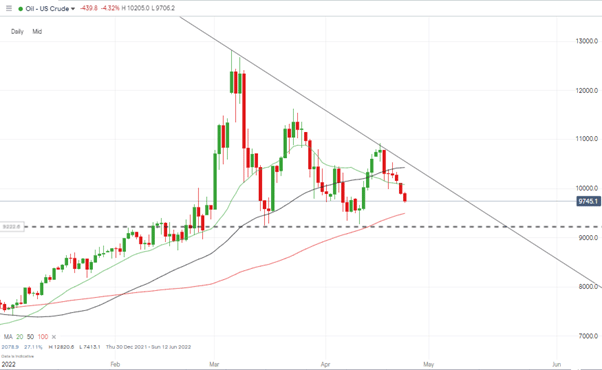
Oil
Oil’s descending wedge pattern still offers a $92 – $105 per barrel trading range. Also of interest is that last week’s sell-off brought the 100 SMA on the Daily Price Chart back into play.
US Crude Oil – Daily Price Chart – Descending wedge and support provided by 100 SMA
Source: IG
Long positions
- Entry Level 1: 94.93 – Region of the 100 SMA on the Daily Price Chart. This metric has proven to be a guide for trade entry points.
- Entry Level 2: 92.00 – A more conservative entry point based on the support found at this price level in March and April of 2022.
- Price Target 1: 109.19 – Price high of 18th April 2022.
- Stop Loss: < 91.00 – Sits below the $92 support level but a breakthrough of $92 could well lead to a test of $90, so a tight loss would appear the best option.
Forex
EURUSD
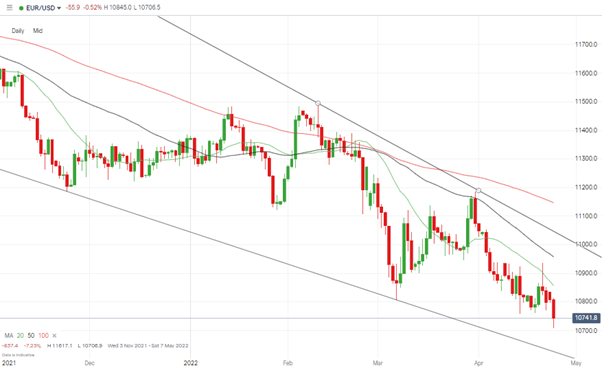
Last week’s trading ideas report pointed towards further euro weakness, and following a momentary price spike, the EURUSD currency pair has continued to fall in value. That spike took the price as high as the 20 SMA on the Daily Price Chart and triggered the opening of profitable short positions.
The confirmation of Macron’s victory in the French presidential election has done little to stem the flow meaning the path of least resistance is still downward.
EURUSD – Daily Price Chart – Bearish Indicators & 50 SMA Resistance
Source: IG
Short positions
- Entry Level 1: 1.0859 – Region of the 20 SMA on the Daily Price Chart.
- Price Target 1: 1.0621 – Region of supporting trendline of downwards price channel.
- Stop Losses: > 1.0957 – Current region of the 50 SMA and close to the 1.10 psychologically important price level.
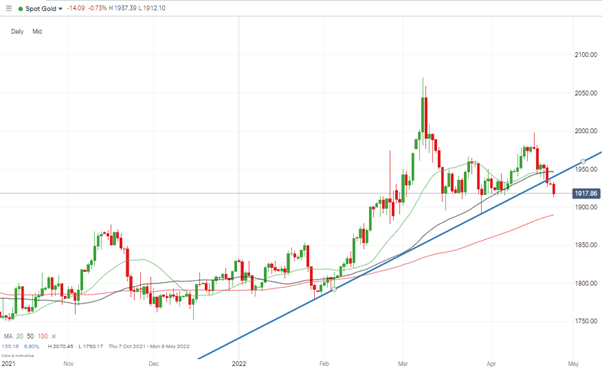
Gold
The metal’s double-top price pattern still limits upward price movement, but it is fundamental analysis factors that are causing the recent weakness in the price of gold. More statements from central bankers about hawkish interest rate policies are likely to cause further problems for goldbugs due to the likelihood those rates will be passed on to holders of bank saving accounts.
Gold – Monthly chart – Trendline Break
Long positions
- Entry Level 1: 1,889 – Region of the 100 SMA on the Daily Price Chart.
- Price Target 1: 1,945 – 1,947 Region of the 20 and 50 SMAs on the Daily Price Chart. Both metrics have in recent months proved reliable indicators. The supporting trend line currently sits in the region of 1,940, which adds to the feeling that 1,940 – 1,950 is now a significant support/resistance level for gold.
- Stop Loss: < 1,848 – 75.76% Fibonacci retracement level of the bull run dating back to 28th January 2022.
Crypto – Bitcoin & Ethereum
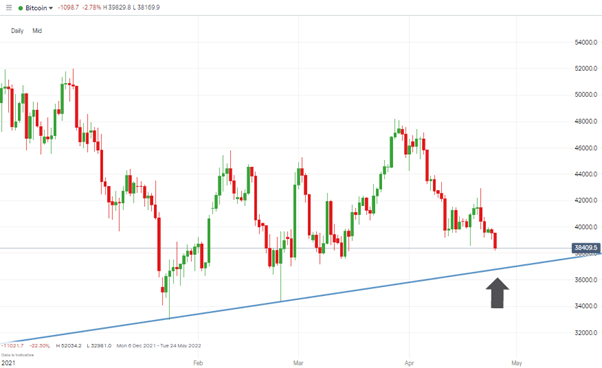
Talk of higher interest rates also proved bad news for cryptocurrencies last week. Bitcoin lost more than 4% in value, and Ethereum was down more than 6%. Those looking to buy into the dips will note that key supporting trendlines are coming into play.
Bitcoin – Daily Price Chart – Key trendline coming into play
Source: IG
Bitcoin Long positions
- Entry Level 1: 36,720 – Region of the supporting trendline dating back to 24th January 2022
- Price Target 1: 48,207 – Year-to-date price high of 28th March 2022.
- Price Target 2: 50,000 – ‘round number’ resistance.
- Stop Losses: < 34,350 – Price low of 24th February 2022.
Ethereum – Daily price chart – Key trendline coming into play
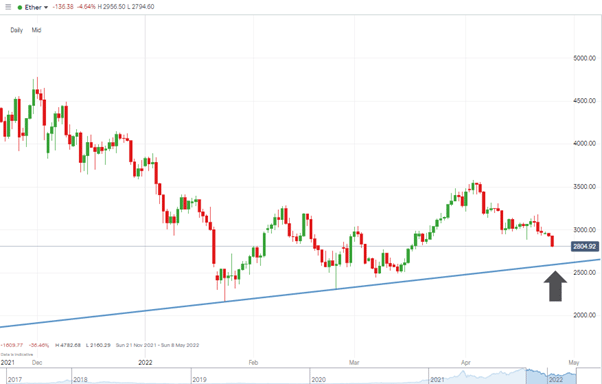
Source: IG
Ethereum Long positions
Ether’s double-bottom or triple-bottom price pattern, formed by price lows of February and March, still holds despite recent price weakness.
- Entry Level: 2,590 – Region of supporting trendline dating back to 24th January 2022.
- Price Target 1: 2,917 – Region of the 100 SMA on the Daily Price Chart
- Price Target 2: 3,580 Price high of 3rd April 2022.
- Stop Losses: < 2,160 – Year-to-date low of 24th January 2022.
Risk Statement: Trading financial products carries a high risk to your capital, especially trading leverage products such as CFDs. They may not be suitable for everyone. Please make sure that you fully understand the risks. You should consider whether you can afford to take the risk of losing your money.

Forextraders' Broker of the Month
BlackBull Markets is a reliable and well-respected trading platform that provides its customers with high-quality access to a wide range of asset groups. The broker is headquartered in New Zealand which explains why it has flown under the radar for a few years but it is a great broker that is now building a global following. The BlackBull Markets site is intuitive and easy to use, making it an ideal choice for beginners.