
Instrument | Price | Hourly | Daily |
EUR/USD | 1.0506 | Strong Sell | Strong Sell |
GBP/USD | 1.2513 | Strong Sell | Strong Sell |
USD/JPY | 130.11 | Buy | Strong Buy |
S&P 500 | 4,168 | Strong Sell | Strong Sell |
NASDAQ 100 | 13,111 | Neutral | Strong Sell |
FTSE100 | 7,476 | Strong Buy | Strong Buy |
Gold | 1,860 | Strong Sell | Strong Sell |
Crude Oil WTI | 104.11 | Buy | Strong Buy |
Bitcoin | 38,460 | Buy | Strong Sell |
Ethereum | 2,839 | Buy | Strong Sell |
UTC 08:05
Our trading signal analysis is based on a comprehensive summary of market data. We use a range of metrics with weighting given to simple and exponential moving averages and key technical indicators.
We created this Weekly Tips section to share possible trade entry and exit points based on our technical analysis. We also have other methods to validate our trades which we can’t publicly share that help to increase their success. All our trades include entry and at least one target price. Stop losses are applied at the reader’s discretion. Our strategies typically trade with a wide stop loss, and risk is further mitigated by trading at a small size.
The FTSE 100 equity index, the euro-dollar currency pair, and crypto market indicators point towards short-term strength and long-term weakness. Trading decisions need to be made with holding periods in mind, and choppy market conditions could prevail in the run-up to the Fed’s big announcement.
FOCUS ON: Markets Set to Pivot on Earnings, Interest Rates, and US Job Numbers
The May Day Public Holiday has resulted in the coming week being shortened, but even if there were five trading sessions, it would be an intense week in terms of trading news. The markets have entered this crucial period in an uncertain mood and with price volatility on the rise, which means strategies trading both short and long time frames are coming into play.
Three major central banks are updating interest rates in the space of three days. First up is the Reserve Bank of Australia (Tuesday), followed by the US Federal Reserve (Wednesday) and the Bank of England on Thursday. The US announcement will be the one to watch out for, but Aussie and Cable forex pairs could be of additional interest this week.
The question in the build-up to the Fed’s announcement has been whether Jerome Powell and the FOMC committee will put through a 50-basis point rate hike even though the US economy contracted by more than 1% in Q1. A half a percentage point rise looks largely priced in at this stage thanks to recent reports marking inflation levels of 8%, so a 25-basis point increase would likely send equity markets surging upwards.
The dilemma facing the central banks is demonstrated by activity in the oil market. Crude is back up above $100 and is simultaneously threatening production levels and higher inflation levels.
The US Non-Farm Payroll numbers will be released on Friday and could add support to any price move triggered by the central bank announcements. Further impetus will be offered by the 160+ members of the S&P 500 index, which will be releasing their Q1 earnings data this week.
Indices
NASDAQ 100
Following last week’s sell-off, it’s make or break time for the NASDAQ. Amazon joined the list of flagship tech firms which disappointed investors. Growth rates in the e-retail division were the lowest since 2001, and the balance sheet continues to be supported by the AWS web-hosting service. As a result, AMZN stock was down more than 10% at one point.
Firms making earnings announcements include AMD (Advanced Micro Devices), which, while smaller in size, is seen as something of a bellwether of the tech sector.
NASDAQ 100 Chart – 1Day Candles – Supporting Trendline
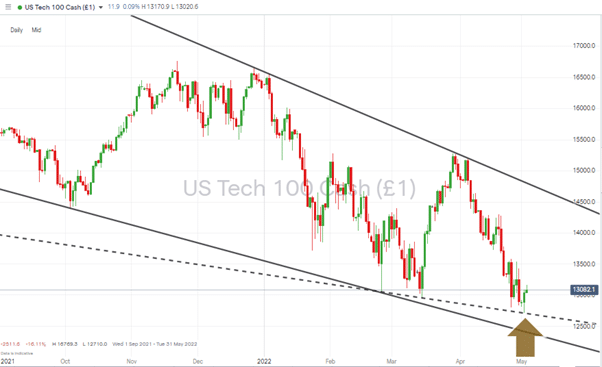
Source: IG
There is a case for bottom-fishing at current price levels. The bounce off the 12,833 price level, which marks the supporting trendline dating back to February 2022, offers some hope for the bulls, and the RSI on the Daily Price Chart is still below 40.
Any break below 12,923 – 13,000 would point to the downward price channel holding and opening the door to tests of support price levels dating back to last year, including 12,411, the close of 4th March 2021.
NASDAQ 100 Chart – 1Day Candles – RSI < 40
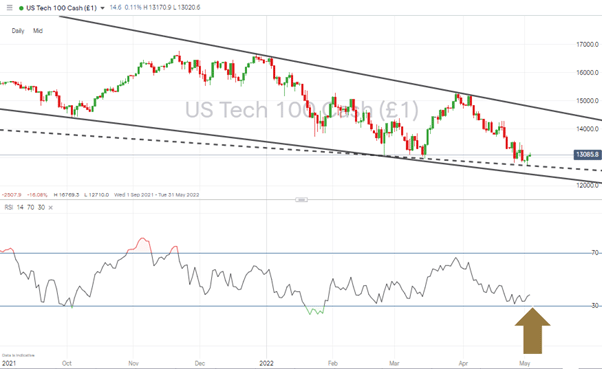
Source: IG
Long positions
- Entry Level 1: 12,944 – Year-to-date price low recorded in March. This entry point was triggered in last week’s report, and those who followed that strategy will already be in profit, but a revisit of that support level can’t be ruled out.
- Entry Level 2: 12,833 – Price low of April and in the region of the dotted supporting trendline.
- Price Target 1: 15,201 – April month-to-date high.
- Stop Loss: < 12,411 – Closing price of 4th March 2021.
NASDAQ 100 Chart – Weekly Candles – Potential Downwards Move
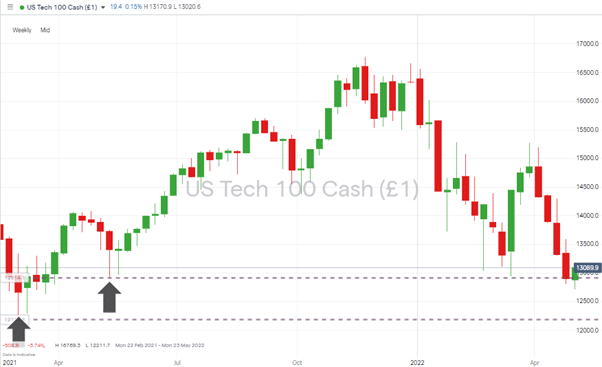
Source: IG
Short positions
- Entry Level 1: 12,923 – Price low of May 2021. Key support level.
- Price Target 1: 12,211 – Price low of March 2021. Another swing-low price support level.
- Stop Loss: > 13,300 – Region of upper end of downwards price channel dating back to 5th April 2022.
FTSE 100
The oil stocks, which make up a significant percentage of the FTSE 100, continue to generate support for the index. The long-position entry point of 7,323, which was flagged up in the Trading Ideas report of 25th April, was triggered thanks to moves in crude and is now in profit. As with the NASDAQ index, the market remains near a critical pivot point and looks ready to take a steer from central bank announcements due to hit the market throughout the week.
FTSE 100 Daily Price Chart – Ready to test 20 SMA
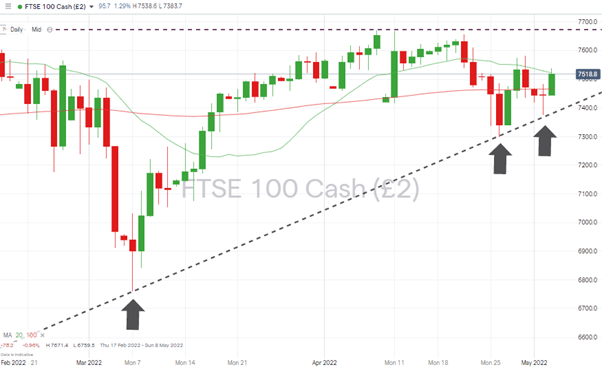
Source: IG
Long positions
- Entry Level 1: 7,522 – Applying a momentum-based strategy and taking a break of the 20 SMA on the Daily Price Chart as a sign that further upward movement is possible.
- Price Target 2: 7,688 – Year-to-date high recorded in February 2022.
- Stop Loss: < 7,386 – Region of the supporting trendline.
Oil
Weakness in the oil price marked the beginning of last week, but with Monday’s low being $95.11, it didn’t quite clip the $94.93 trade entry point suggested in last week’s report. As the price of crude then subsequently shot up to as high as $107.27, that analysis provides a reminder of the need to average into positions and keep track of the ever-changing position of SMAs.
Price is trading back above $100, which suggests the next move could still be upward but would need to be supported by a break of the wedge pattern forming.
US Crude Oil – Daily Price Chart – Descending wedge and support provided by 100 SMA
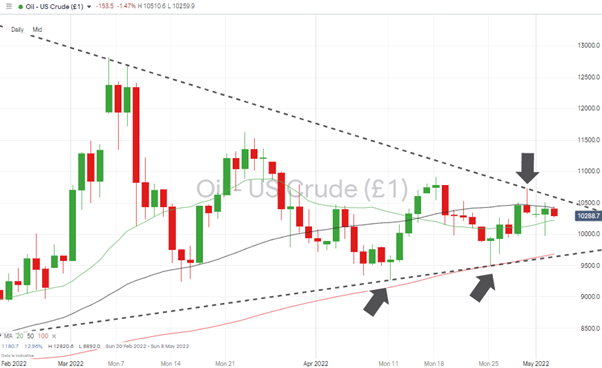
Source: IG
Long positions
Entry Level 1: 96.81 – Region of the 100 SMA on the Daily Price Chart and supporting trend line.
- Price Target 1: 104.20 – Region of 50 SMA on the Daily Price Chart.
- Price Target 2: 105.80 – Region of the line of resistance which forms part of the sideways wedge.
- Stop Loss: < 95.20 – Sits below the supporting trend line and above the psychologically important ‘round number’ price bar of $95.
Forex
GBPUSD
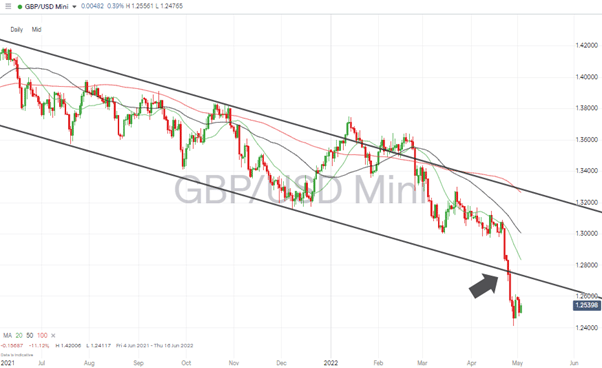
Cable looks set for an interesting week. The Bank of England will announce its latest interest rate news on Thursday, and that key announcement follows a week when GBPUSD broke out of a downward price channel and set new year-to-date lows.
The SMAs on the Daily Price Chart are lagging the price move, so a short-term bounce can’t be ruled out, but the recent sell-off points to the medium-term trend being downward.
GBPUSD – Daily Price Chart – Bearish price action & Trend line break
Source: IG
Short positions
- Entry Level 1: 1.27 – The region of the supporting trendline of the price channel price has just broken out of. A revisit can’t be ruled out due to GBPUSD being short-term oversold, but with price action looking so bearish, a return to downward price movement would appear more likely than a return to trading within the channel.
- Price Target 1: 1.2411 – Price low of Thursday 28th April 2022.
- Stop Losses: > 1.28 – Round number resistance, which is within the price channel and in the region of the 20 SMA on the Daily Price Chart.
Crypto – Bitcoin & Ethereum
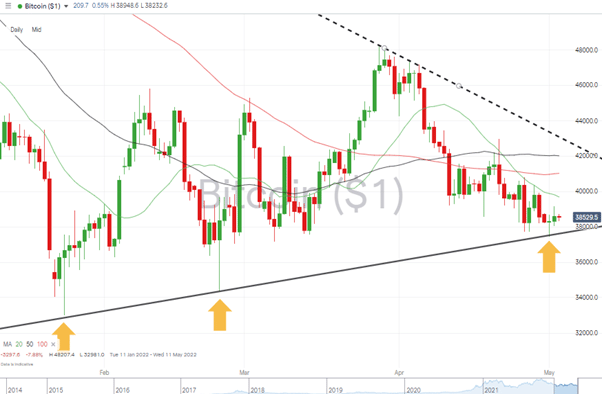
Whatever happened to crypto price volatility? Bitcoin and Ethereum are roughly flat on the week, with Ether’s price move being a tiny +0.14%. Even the gold market held more drama, with the precious metal down 2.82%.
That could be about to change because the price is moving towards the funnel end of a wedge pattern, which means something has to give. Advocates of price falling will point to the SMAs on the Daily Price Charts being above price and offering resistance. At the same time, bullish strategies in Bitcoin can lean on the supporting trend line, which dates back to 24th January 2022 and held firm on 24th February and 1st May.
Bitcoin – Daily Price Chart – Key trendline holds
Source: IG
Bitcoin Long positions
- Entry Level 1: 37,600 – Region of the supporting trendline dating back to 24th January 2022.
- Price Target 1: 42,013 – Region of 50 SMA on Daily Price Chart and upper resistance line of wedge pattern.
- Price Target 2: 45,207 – Year-to-date price high of 28th March 2022.
- Stop Losses: < 34,350 – Price low of 24th February 2022.
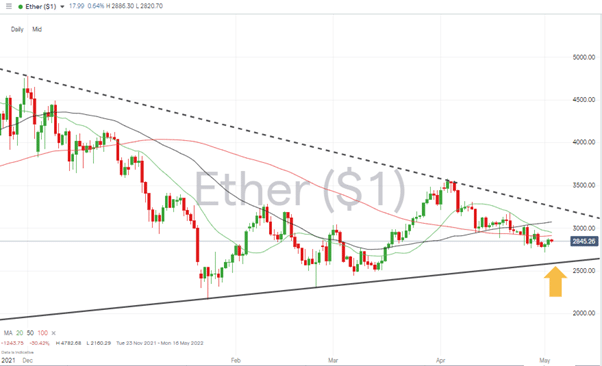
Ethereum – Daily price chart – Wedge Pattern and key supporting trendline coming into play
Source: IG
Ethereum Long positions
Ether’s double-bottom or triple-bottom price pattern formed by the price lows of February and March still holds despite recent price weakness.
- Entry Level: 2,610 – Region of supporting trendline dating back to 24th January 2022.
- Price Target 1: 2,917 – Region of the 100 SMA on the Daily Price Chart.
- Price Target 2: 3,264 – Region of the upper resistance line of wedge pattern.
- Stop Losses: < 2,160 – Year-to-date low of 24th January 2022.
Risk Statement: Trading financial products carries a high risk to your capital, especially trading leverage products such as CFDs. They may not be suitable for everyone. Please make sure that you fully understand the risks. You should consider whether you can afford to take the risk of losing your money.

Forextraders' Broker of the Month
BlackBull Markets is a reliable and well-respected trading platform that provides its customers with high-quality access to a wide range of asset groups. The broker is headquartered in New Zealand which explains why it has flown under the radar for a few years but it is a great broker that is now building a global following. The BlackBull Markets site is intuitive and easy to use, making it an ideal choice for beginners.