
Instrument | Price | Hourly | Daily |
EUR/USD | 1.0500 | Strong Sell | Strong Sell |
GBP/USD | 1.2267 | Strong Sell | Strong Sell |
USD/JPY | 131.20 | Strong Buy | Strong Buy |
S&P 500 | 4,089 | Strong Sell | Strong Sell |
NASDAQ 100 | 12,595 | Strong Sell | Strong Sell |
FTSE100 | 7,377 | Strong Sell | Strong Sell |
Gold | 1,869 | Strong Sell | Strong Sell |
Crude Oil WTI | 108.15 | Strong Sell | Buy |
Bitcoin | 33,520 | Strong Sell | Strong Sell |
Ethereum | 2,450 | Strong Sell | Sell |
UTC 08:05
Our trading signal analysis is based on a comprehensive summary of market data. We use a range of metrics with weighting given to simple and exponential moving averages and key technical indicators.
We created this Weekly Tips section to share possible trade entry and exit points based on our technical analysis. We also have other methods to validate our trades which we can’t publicly share that help to increase their success. All our trades include entry and at least one target price. Stop losses are applied at the reader’s discretion. Our strategies typically trade with a wide stop loss, and risk is further mitigated by trading at small sizes.
The FTSE 100 equity index, the euro-dollar currency pair, and crypto market indicators point towards short-term strength and long-term weakness. Trading decisions need to be made with holding periods in mind, and choppy market conditions could prevail in the run-up to the Fed’s big announcement.
FOCUS ON: Inflation News and Supply Side Issues Looks Set to Steer the Markets
Death by a thousand cuts continues to be the overriding theme for financial markets haemorrhaging cash as investors rotate into risk-off assets. Some disconnects between prices are beginning to appear. Gold is treading water whilst crypto plummets. EURUSD was flat last week whilst GBPUSD posted a >2% loss. The question is whether these divergences in traditional price moves signal the bottom of the sell-off or the edge of a cliff.
Equity indices continue to suffer the brunt of the scramble to safety. Last week’s hectic news week included interest rate announcements from three major central banks and the US employment office. There were few crumbs of comfort for equity investors in the statements from the Reserve Bank of Australia, Bank of England, and US Federal Reserve, but doom and gloom had already been priced in. That leaves the disappointing numbers from market darlings such as Amazon as the key culprit of continued weakness. For many years the earnings season has been when markets have been able to dismiss any fears and continue their upward trajectory. But sentiment has now turned to interpret investor updates with an approach based on a glass half empty rather than half full.
There are fewer potential catalysts lined up which might change the market mood, and most are due to hit the markets in the middle of the week.
In the forex market, the headline announcement is the UK government’s delivery of its Q1 GDP figures on Thursday 12th May. Negative sentiment now surrounds this data release due to the US recently posting their equivalent numbers, which showed the economy contracted in Q1. Cable can be expected to come under further pressure if the GDP report points to the Bank of England having to scale back on its hawkish approach.
Elsewhere, the US and China Consumer Price Index come out on Wednesday, and the US Producer Price Index and Initial Jobless claims on Thursday. None of those data releases carries the weight of the Fed’s interest rate announcement or the Non-Farm Payrolls report, but coming in quick succession, they can be expected to give the market a significant steer.
Indices
NASDAQ 100
Markets have started the week in muted fashion and look unlikely to generate an immediate bounce after Friday’s sell-off. Lockdowns in China are playing heavily on the tech sector, with investors becoming increasingly concerned about supply-side issues. Export growth in China is now at its weakest level for two years.
The inflation data from China and the US on Wednesday will be the big numbers for equity traders.
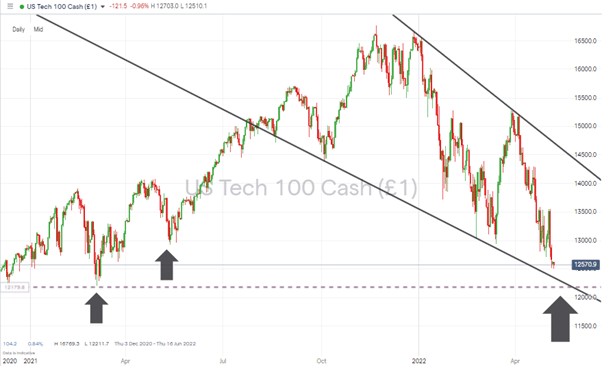
NASDAQ 100 Chart – 1Day Candles – Reaching Supporting Trendlines
Source: IG
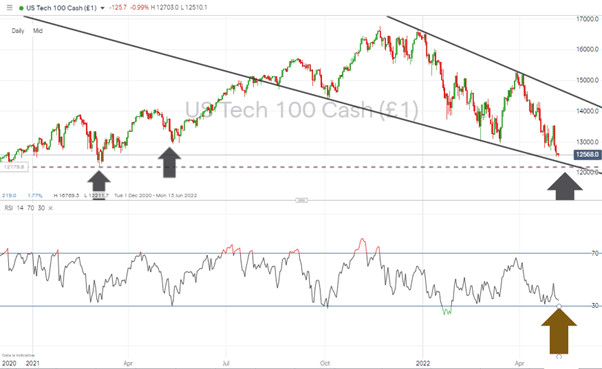
The Nasdaq 100 is approaching two key support levels. The swing low of March 2021 is at 12,211, and the supporting trendline of the downward channel is currently in the region of 12,350. Either could trigger a bounce, and the RSI on the Daily Price Chart has fallen to 34.62, which means it is printing below 35 for the first time since Wednesday 4th May. That makes the index anything but overbought on a daily timeframe.
NASDAQ 100 Chart – 1Day Candles – RSI now < 35
Source: IG
Long positions
- Entry Level 1: 12,350 – Region of the supporting trend line dating to 5th October 2021.
- Entry Level 2: 12,211 Low of 5th March 2021 and key support level.
- Price Target 1: 12,944 – Year-to-date price low recorded in March
- Stop Loss: < 12,000 – Psychologically significant ’round number’ supporting price level.
Short positions
- Entry Level 1: 12,350 – Price low of May 2021. Adopting a breakout/momentum-based strategy.
- Price Target 1: 12,211 – Price low of March 2021. Swing-low price support level.
- Stop Loss: > 13,554 – Price high of last week recorded on Wednesday 4th May 2022.
FTSE 100
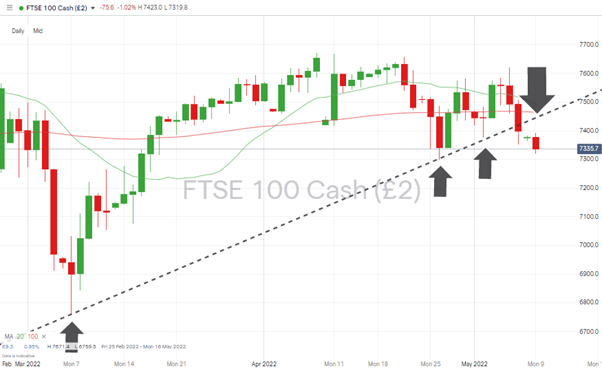
The FTSE lost more than 1% over last week but still outperformed the S&P 500 and NASDAQ 100 indices in relative terms. The GDP figures for Q1, which will be released on Thursday 12th May, will be eagerly watched. The index has broken through a long-term supporting trend line, and a break of the support offered by the swing low of 26th April (7,298) would indicate further weakness is likely.
FTSE 100 Daily Price Chart – Trendline Break
Source: IG
Long positions
- Entry Level 1: 7,298 – Price low of Tuesday 26th April 2022.
- Entry Level 2: 6,959 – Region of the 20 SMA on the Monthly Price Chart. Factors in a test of the psychologically important 7,000 price level and a test below due to stop losses just below 7,000 being triggered.
- Price Target 1: 7,464 – Region of the 100 SMA on the Daily Price Chart and of the trend line which supported price between March and May 2022 but will now act as resistance.
- Stop Loss: < 6,901 – Region of the supporting trendline
Short positions
- Entry Level 1: 7,298 – Applying a momentum-based strategy if price tests and breaks the low print recorded on 26th April 2022.
- Price Target 2: 7,000 – Round number support level and region of the 100 SMA on the Monthly Price Chart
- Stop Loss: > 7,464 – Region of the trendline dating back to March 2022, which was supportive of price, but now offers resistance.
Oil
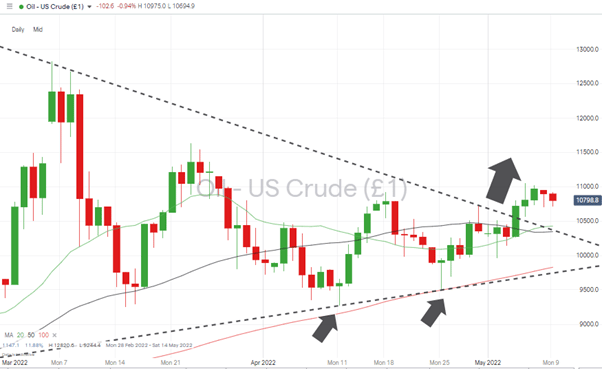
The descending wedge pattern which had been forming since Mid-March has been broken with price bursting through to the upside. This points to the path of least resistance continuing to be upward.
US Crude Oil – Daily Price Chart – Descending wedge breaks to upside
Source: IG
Long positions
- Entry Level 1: 104.26 – Buying the dip during any pullback, which extends to the region of 104.26, the region of the 20 SMA on the Daily Price Chart.
- Price Target 1: 128.20 – Price high of 6th March 2022, which also represents the year to date high for crude.
- Stop Loss: < 103.41 – Region of the upper trend line of the wedge pattern, which previously acted as resistance but now provides support.
Forex
GBPUSD
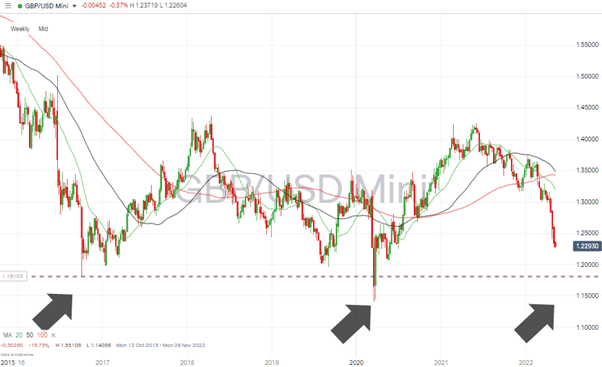
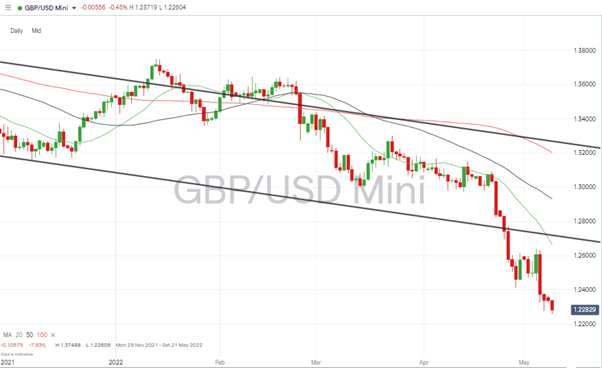
Last week’s Trading Ideas Report identified the potential for weakness in GBPUSD. The price rally on Thursday 4th May took the price as high as 1.263 before a 2.99% price drop kicked in. With price opening the current week trading in the region of 1.2286, the momentum still appears to be pointing downward.
The UK’s GDP numbers due on Thursday could cause short term price volatility, but a test of the Brexit lows of 2016 now looks likely on a medium-term timescale.
GBPUSD – Weekly Price Chart – Bearish price action & test of 2017 price levels
Source: IG
Short positions
- Entry Level 1: 1.235 – Region of the 50 SMA on the Hourly Price Chart.
- Price Target 1: 1.1800 – Price low of October 2016, printed during the height of the Brexit crisis.
- Stop Losses: > 1.270 – Round number resistance and lower trend line of the price channel dating back to April 2021.
GBPUSD – Daily Price Chart – Bearish price action & trendline break
Source: IG
Crypto – Bitcoin & Ethereum
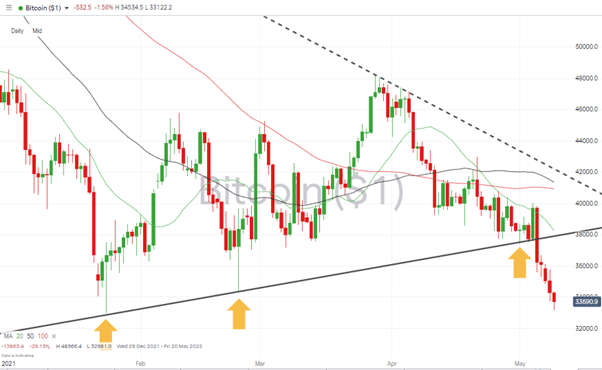
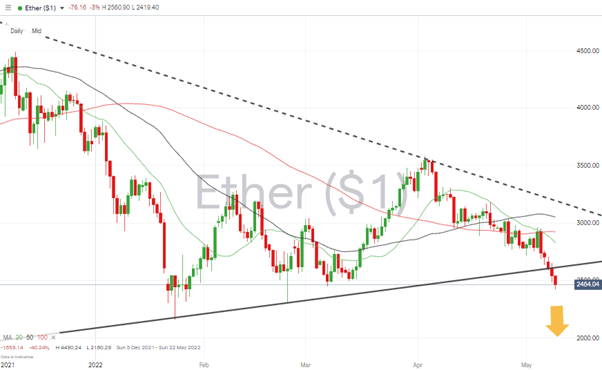
After several weeks of price consolidation dating back to 26th January 2022, crypto prices have now broken to the downside. The break of supporting trend lines of both BTC and ETH has been followed by sustained selling, and a test of the year-to-date lows looks likely.
Bitcoin – Daily Price Chart – Key trendline breaks
Source: IG
Bitcoin Long positions
- Entry Level 1: 32,981 – Price low of 24th January 2022. Also, the year-to-date low.
- Price Target 1: 37,895 – Region of 20 SMA on Daily Price Chart and lower trend line of the wedge pattern.
- Price Target 2: 40,925 – 41,362 – Region of the 100 and 50 SMAs on the Daily Price Chart.
- Stop Losses: < 32,800 – Below price entry point.
Ethereum – Daily price chart – Wedge Pattern and key supporting trendline breaks
Source: IG
Ethereum Long positions
Ether’s double-bottom or triple-bottom price pattern still holds, but some buying pressure needs to come into the market for that to remain the case.
- Entry Level 1: 2,302 – Price low of 24th February 2022.
- Entry Level 2: 2,160 – Price low of 24th January 2022, and also the year-to-date low.
- Price Target 1: 2,613 – Region of the lower trend line of the wedge pattern.
- Price Target 2: 2,828 – Region of the 20 SMA on the Daily Price Chart
- Stop Losses: < 2,160 – Year-to-date low of 24th January 2022.
Risk Statement: Trading financial products carry a high risk to your capital, especially trading leverage products such as CFDs. They may not be suitable for everyone. Please make sure that you fully understand the risks. You should consider whether you can afford to take the risk of losing your money.
Forextraders' Broker of the Month
BlackBull Markets is a reliable and well-respected trading platform that provides its customers with high-quality access to a wide range of asset groups. The broker is headquartered in New Zealand which explains why it has flown under the radar for a few years but it is a great broker that is now building a global following. The BlackBull Markets site is intuitive and easy to use, making it an ideal choice for beginners.
