
Instrument | Price | Hourly | Daily |
EUR/USD | 1.0195 | Strong Sell | Neutral |
GBP/USD | 1.1982 | Neutral | Neutral |
USD/JPY | 136.39 | Buy | Sell |
S&P 500 | 3,956 | Neutral | Strong Buy |
NASDAQ 100 | 12,388 | Neutral | Strong Buy |
FTSE100 | 7,252 | Neutral | Neutral |
Gold | 1,726 | Buy | Sell |
Crude Oil WTI | 93.15 | Strong Sell | Strong Sell |
Bitcoin | 21,869 | Strong Sell | Buy |
Ethereum | 1,517 | Sell | Strong Buy |
UTC: 09:02
Our trading signal analysis is based on a comprehensive summary of market data. We use a range of metrics with weighting given to simple and exponential moving averages and key technical indicators.
We created this Weekly Tips section to share possible trade entry and exit points based on our technical analysis. We also have other methods to validate our trades which we can’t publicly share that help to increase their success. All our trades include entry and at least one target price. Stop losses are applied at the reader’s discretion. Our strategies typically trade with a wide stop loss, and risk is further mitigated by trading in small sizes.
FOCUS ON: All Eyes On The Fed
The focus of last week’s Technical Analysis and Trading Ideas Report was a rebound into risk. That move did materialise and resulted in a range of asset classes experiencing a short-term bounce over the last five trading sessions. Cable and euro-dollar gained more than 50 basis points over the week, and risk-on equity indices also fared well. The S&P 500 was up 1.57% over the week, and the tech-heavy Nasdaq 100 reported a gain of 2.15%.
Price volatility remained in line, and the absence of a spike in that metric suggests the big quant hedge funds running short positions haven’t yet decided this is the bottom of the market. If and when the algorithms of those systematic models flip into buy mode, then substantial buying pressure could lead to a harder, faster rally.
The absence of a moment of market capitulation, when the bulls finally give up, suggests last week’s move into risk could fizzle out and represent a retracement during the longer multi-month downward movement. The good news is that traders don’t have too long until the next clue is released, which might confirm whether or not this is the case.
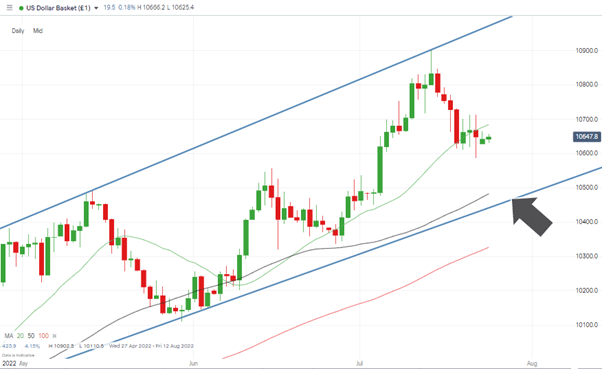
The US Federal Reserve releases its statement on interest rate policy on Wednesday 27th July, and takes centre stage in terms of news flow. Jerome Powell and his colleagues will be hoping their demeanour and comments can restore confidence and stability in the markets; however, rampant inflation means that the policy tools they choose to use could startle investors. There is every chance that for the second meeting in a row, the FOMC will put through a 75-basis point interest rate hike. CME’s FedWatch Tool currently states that markets are pricing in a 76.3% probability of an interest rate rise of that size. The remaining 23.7% of participants are pricing in the rate hike as an even more extreme whole percentage point.
US Dollar Basket Chart – Daily Candles – Mid-range
Source: IG
Forex
GBPUSD
Political uncertainty in the UK looks set to be a major theme during July and August. Weakness in cable has resulted in the UK’ importing inflation’ thanks to commodities such as oil being priced in USD. Consumer price indices continue to surprise to the upside.
A hawkish move by the Bank of England now looks more likely when its officers next meet to discuss rates. The slow and steady route followed so far has seen monthly meetings of the BoE followed by 25 basis point rises in interest rates. However, analysts are forecasting a 0.50% rate hike in August. That provides some support for GBPUSD, which continues to trade around the psychologically important 1.20 price level.
With the Fed’s report dominating the coming week, using the key metric of the 20 SMA on the Daily Price Chart could be the best option for those running short-term strategies.
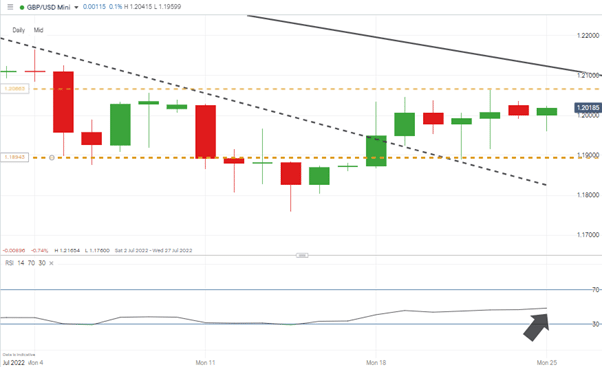
GBPUSD Chart – Daily Candles – RSI of 0.48
Source: IG
The RSI on the GBPUSD Daily Price Chart is almost exactly mid-range. The reading of 48.6 confirms that, for now, traders need to be open to the idea of price moving in either direction.
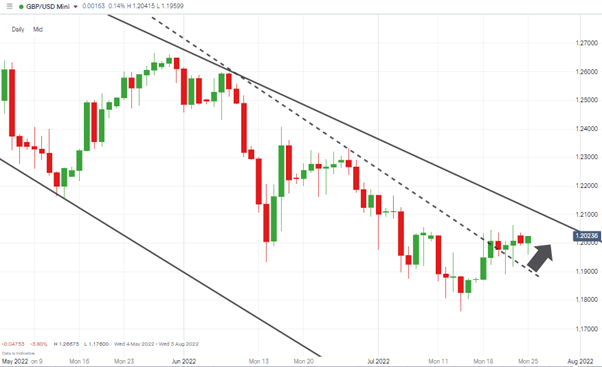
GBPUSD Chart – Daily Candles – Trendline break
Source: IG
Short positions
- Entry Level 1: 1.19687 – Region of 20 SMA and dotted trendline resistance which has moved from being resistance to support.
- Price Target 1: 1.176 – year-to-date price low of 14th July 2022.
- Stop Loss: > 1.20642 – Price high of last week, printed on Friday 22nd July.
Long positions
- Entry Level 1: 1.2000 – round number price support.
- Entry Level 2: 1.19687 – Region of 20 SMA and dotted trendline resistance which has moved from being resistance to support.
- Price Target 1: 1.21179 – Region of the upper trendline of the multi-month downward price channel.
- Stop Loss: < 1.176 – year-to-date price low of 14th July 2022.
EURUSD
The ECB’s decision to take the relatively bold step of increasing rates by 50 basis points on Wednesday 20th July didn’t result in the bounce in EURUSD some might have expected. The currency pair still finished up on the week but has offered few signs of being able to break through the stiff resistance levels it is currently hovering below.
Concerns about Ukraine and power supplies out of Russia refuse to go away and hard data relating to the health of the German economy point towards various factors resulting in a slowdown in economic production. On Friday 22nd July, S&P Global reported that business activity in the eurozone’s most important economy contracted in early July. At the same time, the Manufacturing PMI for the eurozone as a whole fell below 50 for the first time in over two years.
Last week’s bounce in EURUSD could be the start of an uptrend, but many with a longer-term macro view, point to the path of least resistance continuing downward. Chris Williamson, Chief Business Economist at S&P Global Market Intelligence, commented on his firm’s report: “The eurozone economy looks set to contract in the third quarter as business activity slipped into decline in July and forward-looking indicators hint at worse to come in the months ahead.”
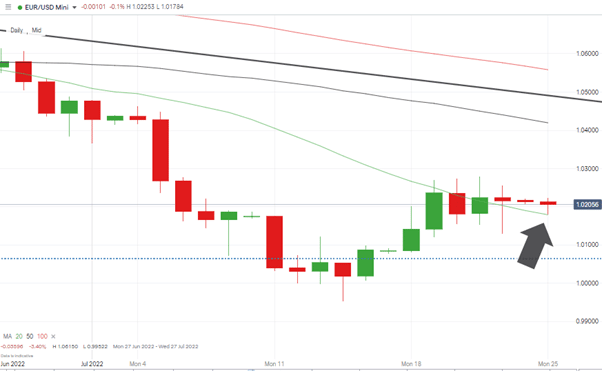
As with GBPUSD, the start of the coming week could be marked by sideways trading and short-lived price moves. Tracking the 20 SMA on the Daily Price Chart could be the best option– at least until the Fed makes its announcement on Wednesday.
EURUSD Chart – Daily Candles – 20 SMA
Source: IG
Short positions
- Entry Level 1: 1.0179 – Region of the 20 SMA on the Daily Price Chart.
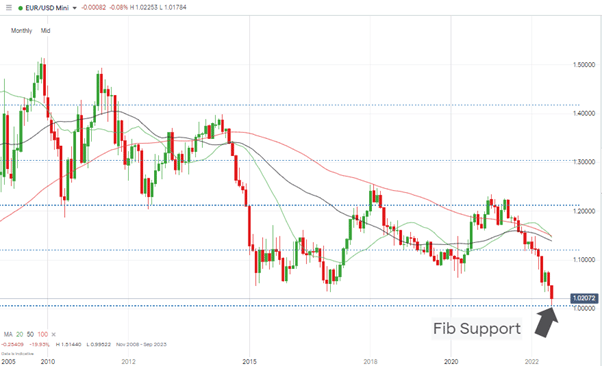
- Price Target 1: 0.99522 – Year to date price low recorded on 14th July 2022 and region of potential triple-bottom on the Monthly Price Chart.
- Stop Loss: > 1.02784 – Price high of last week, posted on Wednesday 21st July.
Long positions
- Entry Level 1: 1.0179 – Region of the 20 SMA on the Daily Price Chart. Looking to trade a bounce off the SMA.
- Price Target 1: 1.02784 – Price high of last week, posted on Wednesday 21st July.
- Stop Loss: < 1.0000 – Psychologically important price level.
EURUSD Chart – Monthly Candles – Buying at Fib Support Level 1.00641
Source: IG
USDJPY
Last week, the Bank of Japan’s decision to keep interest rates on hold marked them out as the odd one out among the G7 central banks. Historical issues relating to low levels of economic growth mean that protecting economic activity is being prioritised by the decision-makers. That points to the yen continuing to weaken in the short and medium term.
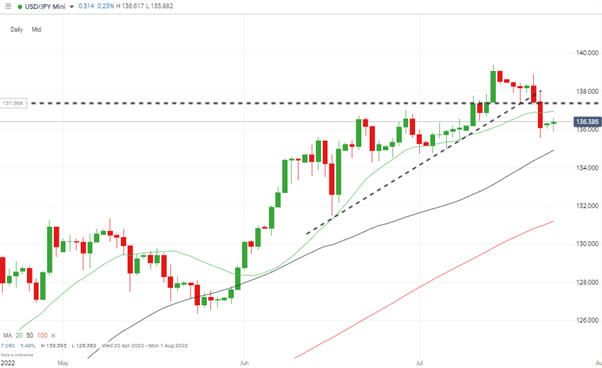
In what looks like a case of ‘buy the rumour, sell the fact’, USDJPY lost value last week despite the dovish move by the BoJ. This could also reflect profit taking by investors who are now recalibrating their models in an effort to establish just how far the yen will be allowed to slide.
USDJPY – Daily Price Chart – Trendline Break
Source: IG
Long positions
- Entry Level 1: 134.91 – Region of the 50 SMA on the Daily Price Chart.
- Price Target 1: 139.39 – Year to date price high printed on 14th July 2022. Below the psychologically important price level of 140.00 which can be expected to offer resistance.
- Stop Loss: < 130.00 – Below the 100 SMA on the Daily Price Chart and the psychologically important round number price support.
Short positions
- Entry Level 1: 136.96 – Selling into strength and using the 20 SMA on the Daily Price Chart as an entry point. That metric having shifted from providing support to offering resistance.
- Price Target 1: 135.56 – Weekly low recorded on Friday 22nd July.
- Stop Loss: > 140.00 – Round number price level.
Indices
NASDAQ 100
US earnings season is throwing up enough surprises to keep the Nasdaq bulls honest, but the upward trend in tech stocks now dates back to mid-June. The markets have already largely priced in a 75-basis point interest rate rise in the US. The niggling doubt for fans of growth stocks is that there is currently a 23% chance that the rise will be 1.0%. That could scupper the recent rally even before earnings season gets into full swing.
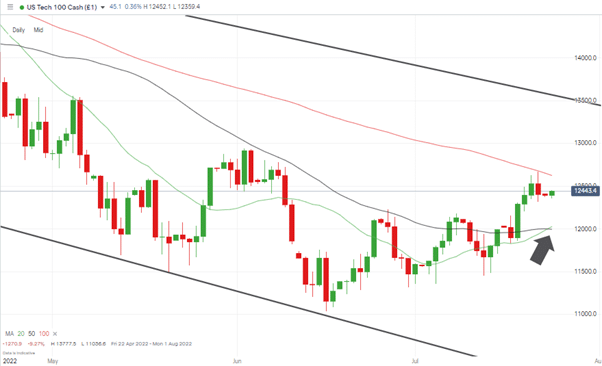
NASDAQ 100 Chart – Daily Candles – 20 and 50 SMAs Intersect
Source: IG
Long positions
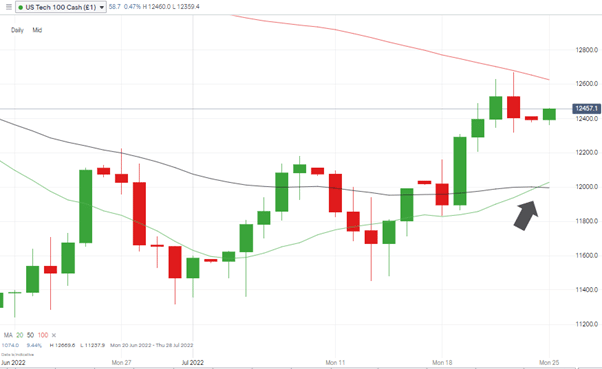
- Entry Level 1: 12,401 – Closing price of Friday 22nd July. Taking the intersection of the 50 SMA by the 20 SMA on the Daily Price Chart as a bullish indicator.
- Price Target 1: 12,624 – Region of the 100 SMA on the Daily Price Chart and intra-day price high of Friday 22nd July.
- Stop Loss: < 12,000 – Psychologically important ’round number’ price level.
NASDAQ 100 Chart – Daily Candles – 20 and 50 SMAs
Source: IG
Crypto – Bitcoin & Ethereum
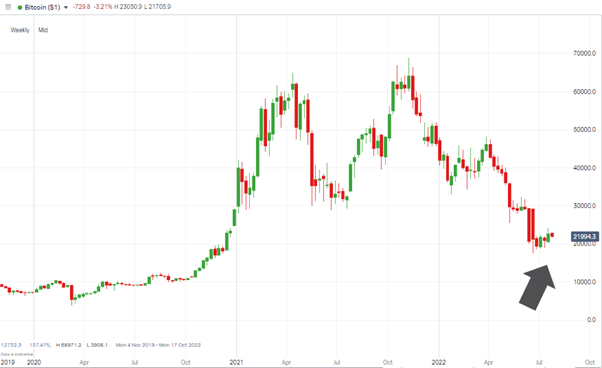
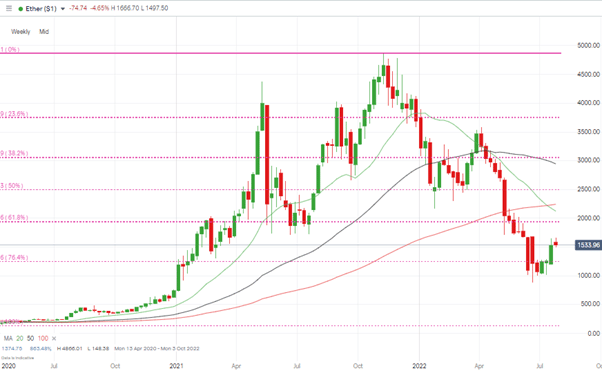
Bitcoin and Ethereum continue to show strength, with ETH outperforming its rival thanks to positive news being released about The Merge. Ethereum posted a 20% week-on-week return for its investors, which could result in crypto news entering the mainstream media again and drawing in a new crowd of buyers.
Bitcoin Price Chart – Weekly Candles
Source: IG
Bitcoin Long positions
- Entry Level 1: 21,532 – Region of 20 SMA on Daily Price Chart.
- Entry Level 2: 19,263 – Region of the 76.4% Fibonacci retracement level dating back to March 2020
- Price Target 1: 28,010 – Region of 100 SMA on Daily Price Chart.
- Stop Losses: < 19,263 – Region of the 76.4% Fibonacci retracement which dates back to March 2020.
Ethereum
Ethereum Chart – Weekly Candles – Fib Support Levels
Source: IG
Ethereum Long positions
- Entry Level 1: 1,341 – Region of 20 SMA on Daily Price Chart.
- Price Target 1: 1,829 – Region of 100 SMA on Daily Price Chart.
- Stop Losses: < 1,294 – Region of 50 SMA on Daily Price Chart.
Risk Statement: Trading financial products carries a high risk to your capital, especially trading leverage products such as CFDs. They may not be suitable for everyone. Please make sure that you fully understand the risks. You should consider whether you can afford to take the risk of losing your money.
Forextraders' Broker of the Month
BlackBull Markets is a reliable and well-respected trading platform that provides its customers with high-quality access to a wide range of asset groups. The broker is headquartered in New Zealand which explains why it has flown under the radar for a few years but it is a great broker that is now building a global following. The BlackBull Markets site is intuitive and easy to use, making it an ideal choice for beginners.
