
Instrument | Price | Hourly | Daily |
EUR/USD | 1.0210 | Buy | Neutral |
GBP/USD | 1.2177 | Buy | Buy |
USD/JPY | 132.56 | Strong Sell | Strong Sell |
S&P 500 | 4,113 | Strong Buy | Strong Buy |
NASDAQ 100 | 12,894 | Strong Buy | Strong Buy |
FTSE100 | 7,410 | Strong Buy | Strong Buy |
Gold | 1,762 | Neutral | Buy |
Crude Oil WTI | 96.73 | Strong Sell | Strong Sell |
Bitcoin | 23,233 | Buy | Sell |
Ethereum | 1,682 | Strong Buy | Sell |
UTC: 08:22
Our trading signal analysis is based on a comprehensive summary of market data. We use a range of metrics with weighting given to simple and exponential moving averages and key technical indicators.
We created this Weekly Tips section to share possible trade entry and exit points based on our technical analysis. We also have other methods to validate our trades which we can’t publicly share that help to increase their success. All our trades include entry and at least one target price. Stop losses are applied at the reader’s discretion. Our strategies typically trade with a wide stop loss, and risk is further mitigated by trading in small sizes.
FOCUS ON: All Eyes On The Fed
After a hectic week of data releases, a range of headline-grabbing moves by risk-on assets sealed record-breaking July returns. The shakedown of economic normality brought on by Covid-19 extends to sayings such as “sell in May, go away” for now, at least, best parked to one side.
After posting the best monthly returns since 2020, the S&P 500 index gained 9.1%, and the Nasdaq Composite index rose 12.4%. The rush by investors into tech stocks, which had been beaten up during the recent bear market, caught many off guard and acted as a barometer of the wider financial system. The question is whether this is a relief rally thanks to markets being oversold on a short-term basis or a committed move by the stock markets, which traditionally bottom out before the ‘real’ economy does.
The broadly risk-on tips which formed last week’s Technical Analysis and Trading Ideas Report would have provided plenty of opportunities to join in the upward price moves in stocks, GBP, EUR and Crude. However, the surprising 2.81% yen gain against the dollar is a reminder that the global economy might not be out of the woods yet. That price change in USDJPY has been put down to a move towards super-defensive currencies like the yen, as investors shield themselves from fundamental economic reports, which still point towards a slowdown in growth.
The US economy technically entered a recession, and the Fed hiked interest rates by 75 basis points for the second month in a row. Neither of the moves could be described as encouraging, and inflation data out of the eurozone points to that genie still being well and truly out of the bottle.
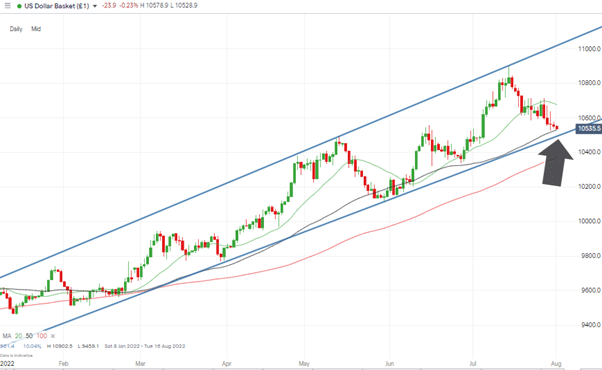
US Dollar Basket Chart – Daily Candles – Support Levels
Source: IG
The US Dollar Basket index is now approaching two key support levels, the 50 SMA on the Daily Price Chart and the supporting trend line with dates back to March 2022. A move down through both of those can’t be discounted, but given the long-term prognosis of the global economy, this week could include some positive rebound style moves for the USD.
Forex
GBPUSD
Cable gained 1.63% during the week, which could be credited to the stabilising political situation. The two-horse race between Rishi Sunak and Liz Truss for the leadership of the Conservative Party and the position of prime minister is looking more like a one-horse race, with Truss extending her opinion poll lead over her rival.
Both candidates have different takes on tax rates to face the challenges confronting the UK economy. While the pros and cons are still being debated, investors have taken comfort that the debate might soon be over with greater certainty instilled in policy measures.
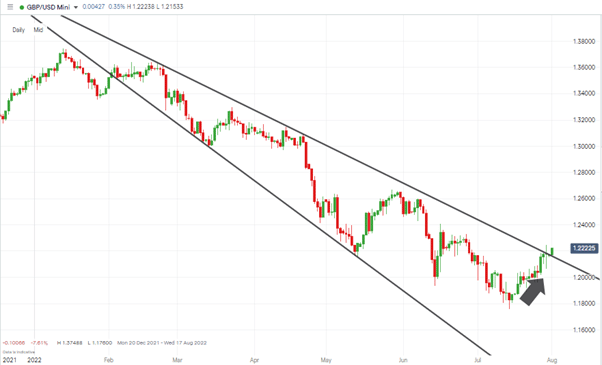
The change in political mood was matched by price creeping out of a multi-month downward trading channel. The coming week could offer greater clarity on whether that is a genuine or a false breakout. Any major moves may be on hold until the Bank of England gives its update on interest rate policy on Thursday 4th August.
GBPUSD Chart – Daily Candles – Breakout
Source: IG
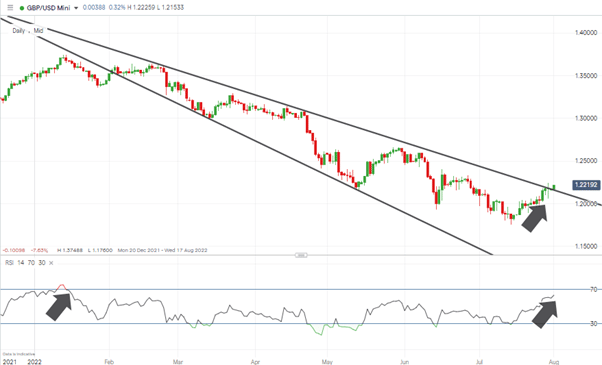
With a view toward the possibility that prices might soften, the last time the GBPUSD RSI indicator on a daily timeframe was at its current level of 63 was in January of this year. That marked the moment when the markets rolled over to begin their descent from 1.36 to 1.17.
GBPUSD Chart – Daily Candles – RSI
Source: IG
Short positions
- Entry Level 1: 1.214 – Region of 50 SMA on the Daily Price Chart. Also, back within the trendlines of the downward price channel dating from January 2022.
- Price Target 1: 1.176 – year-to-date price low of 14th July 2022.
- Stop Loss: > 1.2245 – Price high of last week, printed on Friday 29th July.
Long positions
- Entry Level 1: 1.2166 – Buying into any short-term price weakness involves a ‘kiss’ of the downward trendline, which has switched from resisting to providing support.
- Entry Level 2: 1.214 – Region of 50 SMA on the Daily Price Chart.
- Price Target 1: 1.23922 – Region of the 100 SMA on the Daily Price Chart
- Price Target 2: 1.2245 – Price high of last week, printed on Friday 29th July.
- Stop Loss: < 1.2009 – Region of the 20 SMA on the Daily Price Chart and psychologically important 1.20 price level.
EURUSD
The July meeting of the ECB was marked by the relatively bold decision to increase interest rates by 50 rather than 25 basis points, but more drastic measures may be needed. Eurostat reported last week that eurozone inflation consumer prices climbed to a new record level when they reached 8.9% in July, an increase on the 8.6% number reported in June.
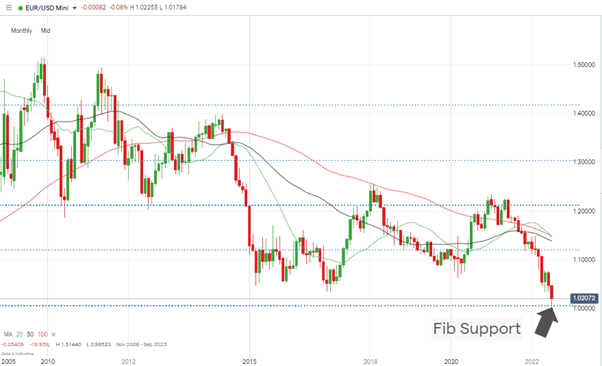
Questions over the reliability of Russian gas and oil exports have turned into a game of bluff and counter-bluff. None of which offers much comfort to industrialists and investors. But downward movement in EURUSD would have to deal with the Fibonacci retracement support level at 1.006 and the psychologically important parity price level that price bounced off in the second half of July.
EURUSD Chart – Monthly Candles – Buying at Fib Support Level 1.00641
Source: IG
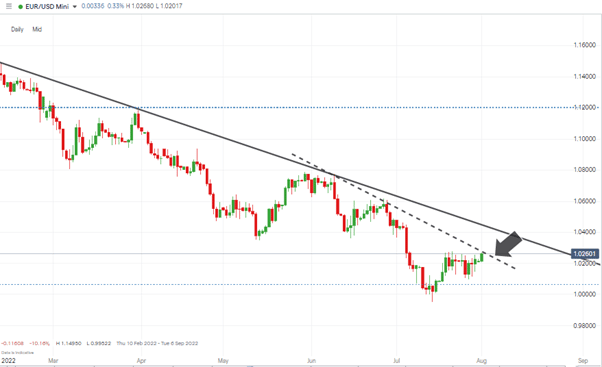
The coming week is very light in terms of EURUSD-related news announcements, leaving time for technical metrics to come into play. Further upward price moves are hampered by two downward trendlines that currently sit in the region of 1.026 and 1.046.
EURUSD Chart – Daily Candles – Trendlines
Source: IG
Short positions
- Entry Level 1: 1.028 – Region of the dotted downward trendline
- Price Target 1: 1.01574 – 20 SMA on the Daily Price Chart.
- Price Target 2: 0.99522 – Year to date price low recorded on 14th July 2022 and region of potential triple-bottom on the Monthly Price Chart.
- Stop Loss: > 1.0356 – Region of the 50 SMA on the Daily Price Chart.
Long positions
- Entry Level 1: 1.0179 – Waiting for a pullback to the region of 20 SMA on the Daily Price Chart.
- Price Target 1: 1.02677 – Upper end of sideways channel formed in the second half of July.
- Stop Loss: < 1.0000 – Psychologically important price level.
USDJPY
Thursday’s GDP release in the US confirmed that the economy had technically entered a recession after two consecutive quarters of negative growth. The yen rallied in response, thanks to the currency’s position as a safe haven asset.
The US Federal Reserve also hinted that guidance on interest rates might be turning more dovish. Federal Reserve chair Jerome Powell suggested the FOMC will follow a more ‘data-dependent style’ and a ‘meeting-by-meeting approach’. That allows more wriggle room for future US rate hikes to be less severe than those announced at the last two meetings.
USDJPY Chart – Daily Candles – Trendlines
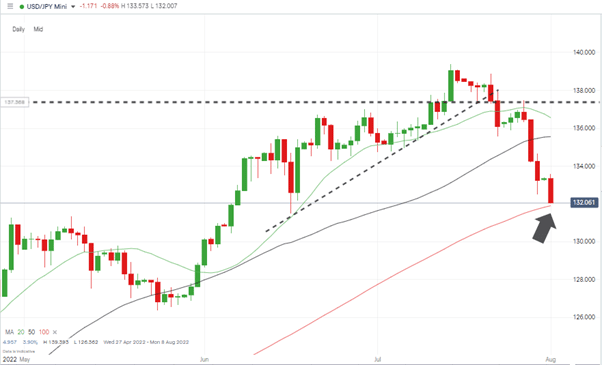
Source: IG
All eyes will be on the 100 SMA on the Daily Price Chart, which currently sits at 131.90. The sell-off during the last week does mean investors stepping in at this level will be running the risk of catching a falling knife, but short-term metrics point to the market currently being oversold.
Long positions
- Entry Level 1: 131.90 – Region of the 100 SMA on the Daily Price Chart.
- Price Target 1: 135.55 – Region of the 50 SMA on the Daily Price Chart.
- Price Target 2: Year-to-date price high printed on 14th July 2022.
- Stop Loss: < 130.00 – Psychologically important round number price support.
Short positions
- Entry Level 1: 135.55 – Region of the 50 SMA on the Daily Price Chart.
- Price Target 1: 131.90 – Region of the 100 SMA on the Daily Price Chart.
- Stop Loss: > 140.00 – Round number price level.
Indices
NASDAQ 100
Big tech earnings season data has been a mixed bag, but there have been enough positive announcements to spur on stocks. Amazon reported a miss on earnings of 20 cents per share, but high-level revenue growth was in line with expectations at $121.23bn. Apple was the pick of the bunch and beat expectations on revenue and profit. The firm downgraded its guidance for Q3, but many still started snapping up AAPL shares after the 2022 sell-off.
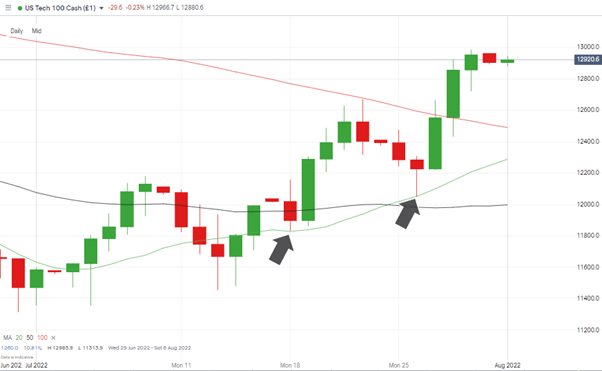
Those looking to buy into the current rally might want to show some patience and wait for a pullback to the 20 SMA on the Daily Price Chart – currently in the region of 12,287.
NASDAQ 100 Chart – Daily Candles – 20 SMA Support
Source: IG
Long positions
- Entry Level 1: 12,287 – Region of the 20 SMA on the Daily Price Chart, which provided support on 18th and 26th July.
- Price Target 1: 13,000 – Round number resistance and close to July and August price highs.
- Stop Loss: < 12,000 – Psychologically important ’round number’ price level.
Crypto – Bitcoin & Ethereum
Bitcoin and Ethereum remain on the front foot, but for the third week running, ETH has been outstripping BTC’s price gains. Investor confidence is growing about the prospects of The Merge and a move towards more energy-efficient Proof-of-Stake protocols.
Bitcoin Price Chart – Weekly Candles
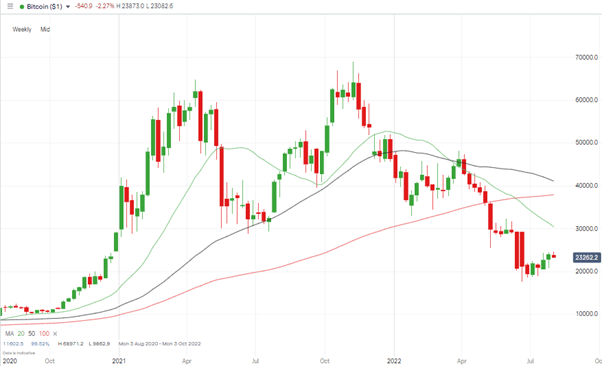
Source: IG
Bitcoin Long positions
- Entry Level 1: 22,341 – Region of 20 SMA on Daily Price Chart.
- Entry Level 2: 19,263 – Region of the 76.4% Fibonacci retracement level dating back to March 2020
- Price Target 1: 26,792 – Region of 100 SMA on Daily Price Chart.
- Stop Losses: < 19,263 – Region of the 76.4% Fibonacci retracement which dates back to March 2020.
Ethereum
Ethereum Chart – Weekly Candles – Fib Support Levels
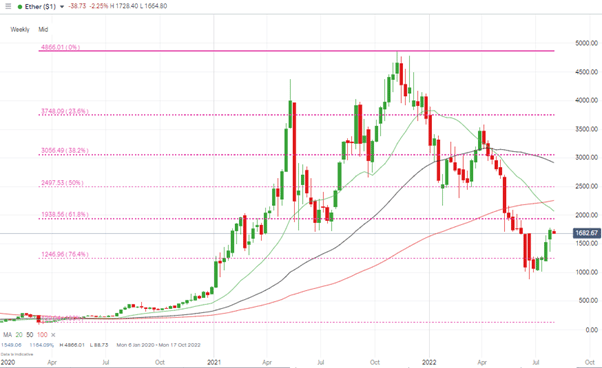
Source: IG
Ethereum Long positions
- Entry Level 1: 1,508 – Region of 20 SMA on Daily Price Chart.
- Price Target 1: 1,732 – Region of 100 SMA on Daily Price Chart.
- Stop Losses: < 1,286 – Region of 50 SMA on Daily Price Chart.
Risk Statement: Trading financial products carries a high risk to your capital, especially trading leverage products such as CFDs. They may not be suitable for everyone. Please make sure that you fully understand the risks. You should consider whether you can afford to risk losing your money.

Forextraders' Broker of the Month
BlackBull Markets is a reliable and well-respected trading platform that provides its customers with high-quality access to a wide range of asset groups. The broker is headquartered in New Zealand which explains why it has flown under the radar for a few years but it is a great broker that is now building a global following. The BlackBull Markets site is intuitive and easy to use, making it an ideal choice for beginners.