
FOCUS ON: Big News Week as Central Banks Limber Up to Stir the Markets
- Inflation continues to be the main price driver of forex and stock markets
- Red-hot CPI data out of the US takes markets lower into the close of the week
- Three central banks line up to make announcements on interest rate levels
Inflation and interest rate levels have played a significant role in determining the course of the markets during 2022, so three major central banks lining up to make rate announcements in the same week is an important event. Japan, the UK, and, most importantly, the US interest rate policy is set to be updated. Each event has the potential to move market prices, but with their release dates converging on 21st and 22nd September, there is potential for significant trends to be formed.
First to the table is the US Federal Reserve which will announce its new interest rate target levels on Wednesday 21st September. Following several rounds of record-breaking announcements, traders will be waiting with some anticipation for that update which will be released at 2 pm EST, 7 pm BST.
There is uncertainty about what could be in store when Fed Chair Jerome Powell and his FOMC colleagues meet to discuss US rates policy. The previous two announcements have been unprecedented 0.75% rises, and another move of at least that scale is priced into expectations. The surprise element is whether a 1% rate rise is declared in what many are dubbing the “nuclear” option. The chances of a 100-basis point rise have increased following the worse-than-expected US CPI report that shook the markets last week. Current indications from CME’s FedWatch tool are that a 75bp increase is 80% likely, and there is a 20% chance of a 100bp hike.
In contrast, the Bank of Japan is expected to take no action when it sets its interest rate policy on Thursday 22nd September, but more uncertainty surrounds the call the Bank of England might make. Whilst UK rates are set to rise, the question is by how much?
US Dollar Basket Chart – Daily Candles – Trading Mid-range
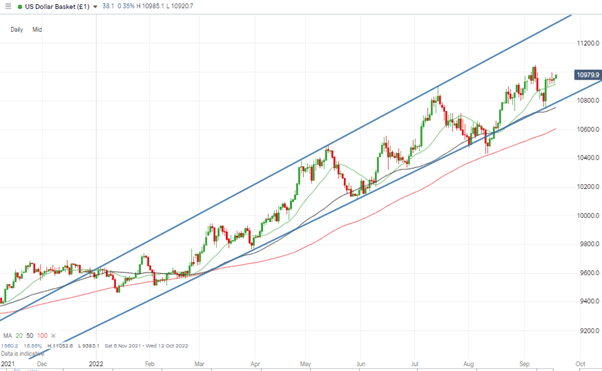
Source: IG
The US Dollar basket’s multi-month upward price channel continues to hold. With price trading mid-range, there is potential for this week’s interest rate news to generate price moves which have some way to travel before meeting the significant resistance posed by that channel’s tramlines.
Instrument | Price | Hourly | Daily |
EUR/USD | 0.9976 | Strong Sell | Strong Sell |
GBP/USD | 1.1359 | Strong Sell | Strong Sell |
USD/JPY | 143.47 | Strong Buy | Strong Buy |
S&P 500 | 3,832 | Strong Sell | Strong Sell |
NASDAQ 100 | 11,728 | Sell | Strong Sell |
FTSE100 | 7,192 | Strong Sell | Strong Sell |
Gold | 1,662 | Strong Sell | Strong Sell |
Crude Oil WTI | 83.05 | Strong Sell | Strong Sell |
Bitcoin | 18,405 | Strong Sell | Strong Sell |
Ethereum | 1,293 | Strong Sell | Strong Sell |
Forex
GBPUSD
Continued weakness in GBPUSD took the cable exchange rate to a new year-to-date low of 1.13505 on Thursday 15th September. The BoE’s decision to delay its interest rate announcement as a mark of respect for Her Majesty Queen Elizabeth II left sterling in freefall. That increases the chances of the Bank’s Governor taking more dramatic action on Thursday. A rate hike of 50 basis points is currently forecast, so anything above that could result in GBPUSD showing signs of bottoming out, at least on a short-term basis.
GBPUSD Chart – Daily Candles – New Year to Date Low
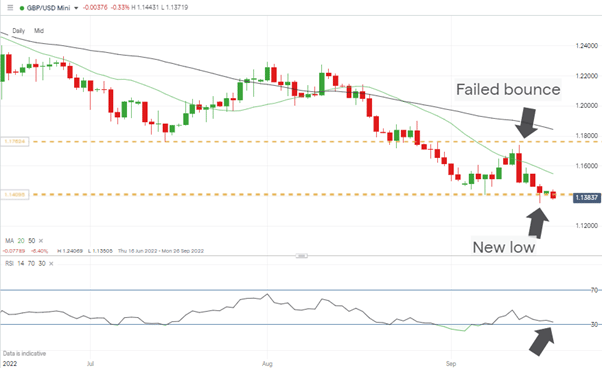
Source: IG
The price chart for GBPUSD is decidedly bearish. The break of the 1.14098 price level, which marked the low of March 2020, opens the door to further downward movement. One metric to factor in is the RSI on the Monthly Price Chart, which is at 26.75, representing the lowest reading since 2017. Before that date, the last time the Monthly RSI was below 30 was in 2009.
GBPUSD Chart – Monthly Candles – RSI < 30
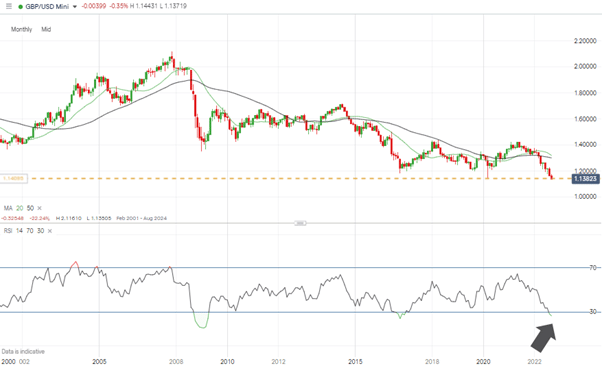
Source: IG
With important interest rate announcements due later in the week, there is a chance that price trades sideways prior to the news being released. The significant support and resistance levels of 1.13505 and 1.14053 being likely guides to the lower and upper levels of any consolidation pattern,
Short positions
- Entry Level 1: 1.14053 – Selling into any strength which takes price to the resistance offered by the price low of 7th September 2022.
- Price Target 1: 1.13505 – Month to date price low of Friday 16th September.
- Stop Loss: > 1.14374 – Region of the 50 SMA on the Hourly Price Chart.
Long positions
- Entry Level 1: 1.13505 – Month to date price low of Friday 16th September. Multi-year price low which could act as support if BoE rate announcement is favourable.
- Price Target 2: 1.14053 – Selling into any strength which takes price to the resistance offered by the price low of 7th September 2022.
- Stop Loss: < 1.13505 – As GBPUSD is entering uncharted territory, there are few technical indicators sitting below this level and tight stop losses would be recommended for those looking to pick the bottom of the market.
EURUSD
The Technical Analysis and Trading Ideas Report of 12th September factored in the chance of EURUSD posting a short-term rally, and the surge on Monday 12th September did take EURUSD up to as high as 1.01980. The failure to break the ’round number’ 1.02 price level and weakness in the face of the downward resistance trendline point to the path of least resistance continuing to be to the downside.
EURUSD Chart – Daily Candles – Rally to Resistance and Fall Away
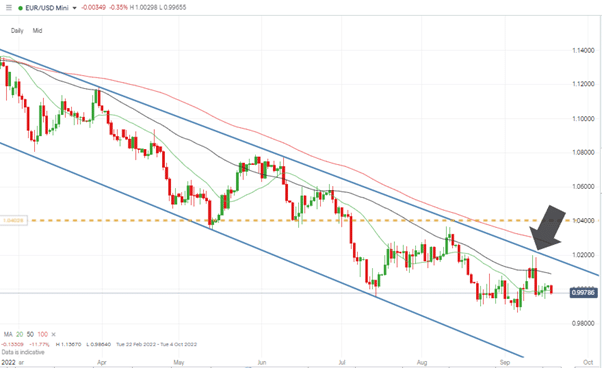
Source: IG
With the RSI on the Daily Price Chart trading mid-range at 44.9, there is potential for EURUSD to form a consolidation pattern before the US Fed announces its next interest rate move on Wednesday.
EURUSD Chart – Hourly Candles – CPI Price Crash and Consolidation
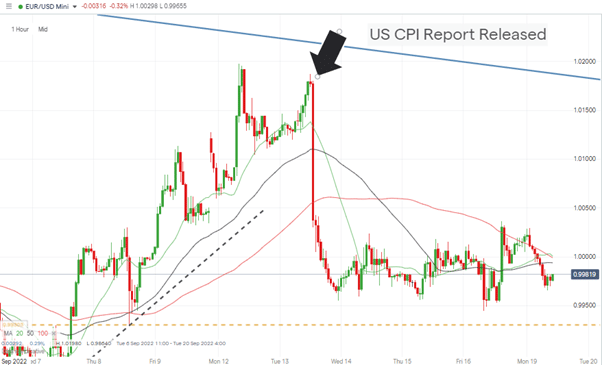
Source: IG
Short positions
- Entry Level 1: 1.000 – Selling into strength at the parity price point with the US dollar. Psychologically important level.
- Price Target 1: 0.99308 – Price low of 8th September.
- Stop Loss: > 1.00904 – Region of the 50 SMA on the Daily Price Chart.
Long positions
- Entry Level 1: 0.99308 – Price low of 8th September.
- Price Target 1: 1.0000 – Parity price level.
- Price Target 2: 1.005 – Region of the short-term trendline on the Hourly Price Chart, which dates back to Wednesday 7th September.
- Stop Loss: < 0.98640 –Price low of Tuesday 6th September.
Indices
NASDAQ 100
Major stock indices fell for the fourth week in five on the back of the US CPI report. Concerns about the health of tech stocks were magnified by some of the flagship names breaking key support levels. Alphabet (GOOGL) and Meta Platforms (META) broke through support levels that had supported both stocks for several weeks. Given the large market capitalisation of those tech giants, there continue to be bearish clouds hovering over the entire index.
NASDAQ 100 Chart – Daily Candles – Downwards Price Channel
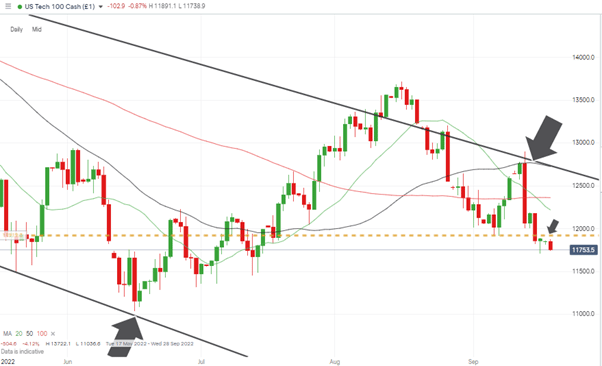
Source: IG
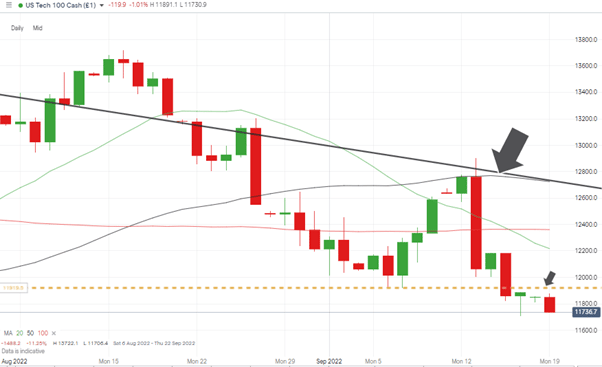
With investors in the big names making a rush for the door, there is some uncertainty about how stocks might react to Wednesday’s interest rate announcement. A 1% rise would be a surprise, and higher rates are typically bad news for stocks. The alternative view is that an extreme move of that scale could offer hope to stock market bulls, who could take it as a sign that the Fed has finally fired a ‘silver bullet’ which will kill off inflation and act as the starting gun of the next long-term bull market.
NASDAQ 100 Chart – Daily Candles – Price Now Below Support / Resistance Line
Source: IG
Short positions
- Entry Level 1: 11,917 – Price low of Wednesday 7th September 2022. Selling into strength which takes price back up to this level which previously acted as support but now offers resistance.
- Price Target 1: 11,706 – Price low of Friday 16th September 2022. A short-term scalping strategy could be used to trade sideways price movement before the Fed’s interest rate announcement.
- Stop Loss: >12,217 – Area of the 20 SMA on the Daily Price Chart.
Long positions
- Entry Level 1: 11,706 – Price low of Friday 16th September 2022.
- Entry Level 2: 11,036 – Price low of Friday 16th June 2022.
- Both entry levels use support offered by previous swing-low price points.
- Price Target 1: 11,917 – Price low of Wednesday 7th September 2022.
- Price Target 2: 12,725 – In extension, the region of the 50 SMA on the Daily Price Chart.
- Stop Loss: < 11,036.
Crypto – Bitcoin & Ethereum
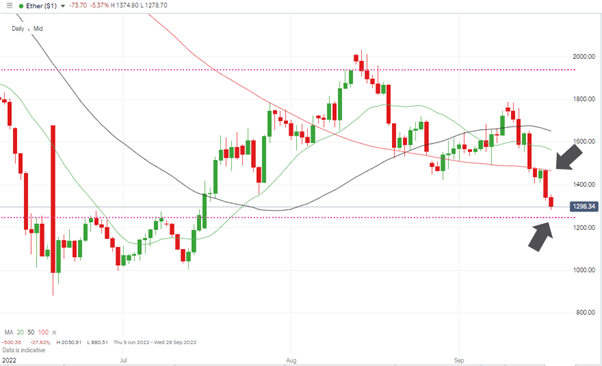
One of the crypto sector’s most significant developments of 2022 was finally announced last week when Ethereum confirmed that The Merge had been processed. The tech upgrade represented by the change to Proof of Stake protocols is one of the market’s long-awaited events.
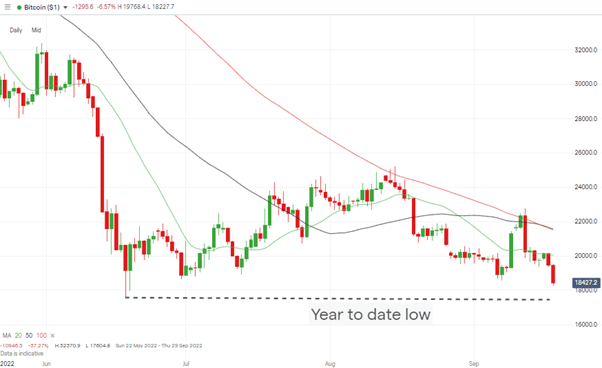
The bad news for investors, in the short-term at least, is that this looks like a case of “buy the rumour, sell the fact”. Both bitcoin and ether gave up recent gains and are now heading towards long-term price support levels. Ether’s +25% loss of value in one week has taken it below key support levels but could be a buying opportunity for those who believe The Merge offers improved long-term prospects for ETH.
Bitcoin Price Chart – Closing in on Year-to-Date Lows
Source: IG
Bitcoin Long positions
- Entry Level 1: 17,604 – Year to date price low of 18th June
- Price Target 1: 20,017 – Region of 20 SMA on Daily Price Chart. Just above the psychologically important price level of $20,000.
- Stop Losses: < 17,604 – The absence of any technical indicators below the $17,604 price level suggests any break of that support could be a significant long-term move, and tight stop losses would therefore be advisable.
Ethereum
Ethereum Chart – Daily Candles – Break through Key SMAs
Source: IG
Ethereum Long positions
- Entry Level 1: 1,246 – 76.4% Fibonacci retracement resistance level of the rally which started in March 2020.
- Price Target 1: 1,465 – Region of the 100 SMA on the Daily Price Chart.
- Stop Losses: < 880 – Price low of 17th June 2022.
Risk Statement: Trading financial products carries a high risk to your capital, especially trading leverage products such as CFDs. They may not be suitable for everyone. Please make sure that you fully understand the risks. You should consider whether you can afford to take the risk of losing your money.

Forextraders' Broker of the Month
BlackBull Markets is a reliable and well-respected trading platform that provides its customers with high-quality access to a wide range of asset groups. The broker is headquartered in New Zealand which explains why it has flown under the radar for a few years but it is a great broker that is now building a global following. The BlackBull Markets site is intuitive and easy to use, making it an ideal choice for beginners.