
FOCUS ON: Earnings Season Set To Move The Agenda On From Inflationary Concerns
- Last week’s hotter-than-expected US CPI inflation report subdued investor sentiment, but attention is turning to the US Q3 earnings season.
- The regular updates from big corporations offer insight into the health of the biggest corporations in the world.
- Expect daily data reports to impact prices in multiple asset groups.
Thursday’s US Consumer Price Index inflation report provided another reminder that the Fed’s hawkish interest rate policy could still have some way to go. Consumer prices in September rose by a higher-than-expected 0.4%, and market analysts are now predicting US interest rates will increase by 0.75% in November and December.
The bad news for stock owners was that wages fell by 0.1% month on month and are now 3% lower than at this time last year. Rising prices and falling wages point to the US consumer being squeezed. As a result, the Nasdaq 100 index posted another down week, losing 2.04% in value, while the S&P 500 index gave up 0.52%.
Crude oil’s 6.90% week-on-week price slide did little to lighten the mood. Hopes remain that supply-side issues can be resolved, but the drop in the price of crude reflects that even oil traders are aware that domestic and corporate spending around the world is under threat.
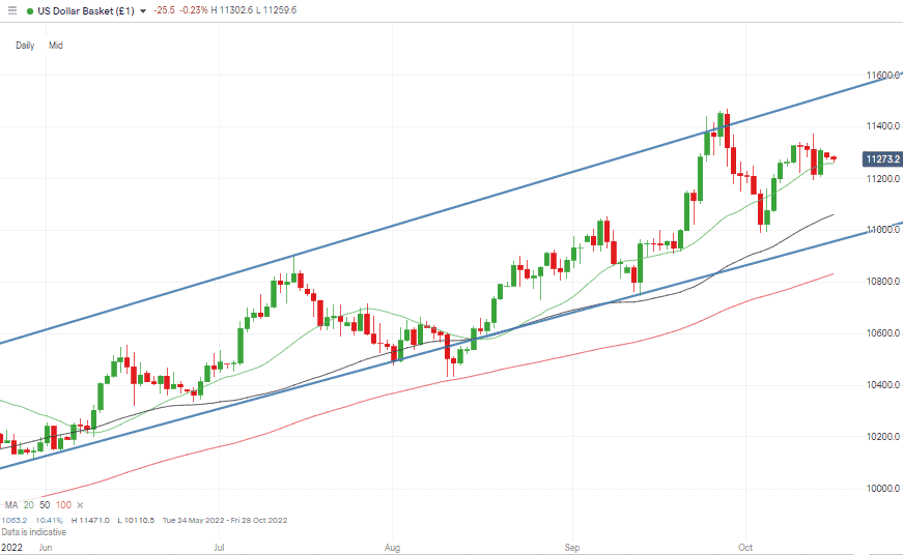
Forex markets had already priced in a lot of the bad inflation news and continued to trade sideways after some initial whipsawing. The intraday volatility on Thursday 13th and Friday 14th October provided opportunities for day traders. However, with no significant change in current price patterns, traders are left waiting for signs of which way the market might head next.
US Dollar Basket Chart – Daily Candles – Mid-Channel
Source: IG
Given the indecision in the market, major forex pairs are forming sideways wedge-patterns, with GBPUSD and EURUSD currently showing a willingness to funnel into the point of the wedge. At some time, a breakout to the upside or downside will materialise, and it could be earnings season data which ultimately acts as a catalyst for the next move.
Tesla is among the high-profile firms releasing their Q3 earnings reports this week, and those statements can be expected to be the most likely triggers of any breakout.
Instrument | Price | Hourly | Daily |
EUR/USD | 0.9747 | Strong Buy | Strong Sell |
GBP/USD | 1.1263 | Strong Buy | Buy |
USD/JPY | 148.62 | Strong Buy | Strong Buy |
S&P 500 | 3,614 | Strong Sell | Strong Sell |
NASDAQ 100 | 10,795 | Strong Sell | Strong Sell |
FTSE100 | 6,869 | Neutral | Strong Sell |
Gold | 1,653 | Buy | Strong Sell |
Crude Oil WTI | 85.32 | Sell | Strong Sell |
Bitcoin | 18,809 | Strong Buy | Neutral |
Ethereum | 1,298 | Buy | Neutral |
UTC: 09:42
Our trading signal analysis is based on a comprehensive summary of market data. We use a range of metrics with weighting given to simple and exponential moving averages and key technical indicators.
We created this Weekly Tips section to share possible trade entry and exit points based on our technical analysis. We also have other methods to validate our trades which we can’t publicly share that help to increase their success. All our trades include entry and at least one target price. Stop losses are applied at the reader’s discretion. Our strategies typically trade with a wide stop loss, and risk is further mitigated by trading in small sizes.
Forex
GBPUSD
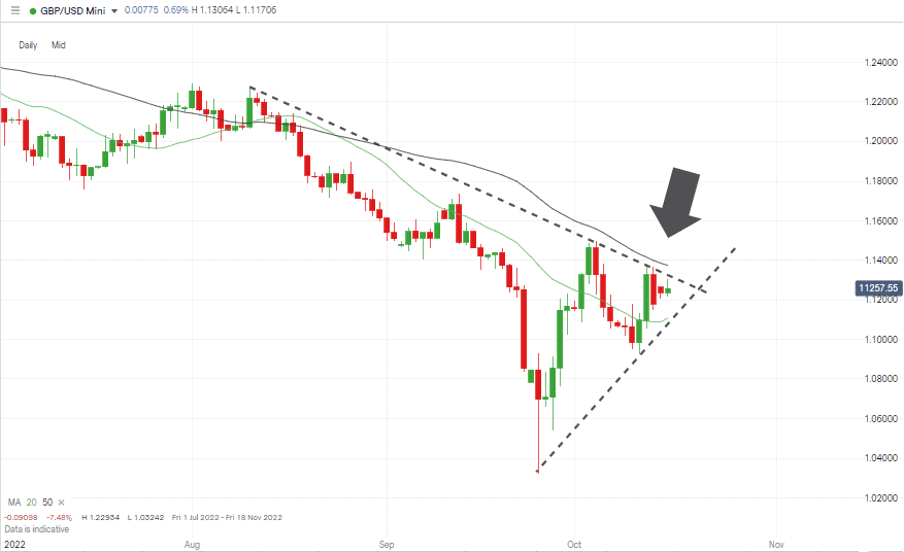
GBPUSD has recently been one of the more volatile major currency pairs. Price has reverted to trading between the highs of August and lows of September, and that consolidating price pattern is leading GBPUSD into the end of a sideways wedge pattern.
GBPUSD Chart – Daily Candles – Wedge Pattern Forming
Source: IG
The drop in price volatility also reflects that the self-inflicted wounds inflicted by the newly formed Truss government have led to a change of chancellor and a new directive to restore stability. So far, traders are buying into the mantra of the new regime, with Monday’s trading activity remaining within the trading range of Friday’s daily candle.
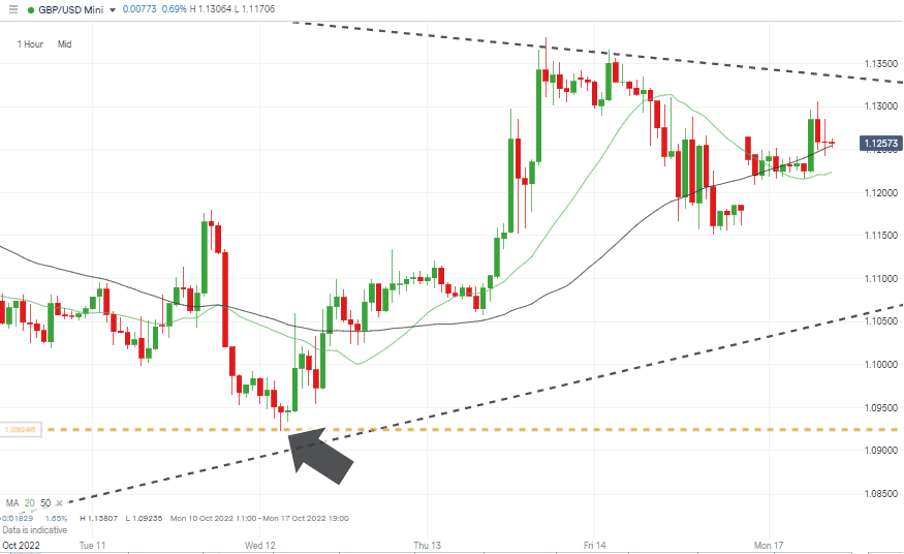
GBPUSD Chart – Hourly Candles – Bounce Off Key Support
Source: IG
With price trading halfway between the 20 and 50 SMAs on the Daily Price Chart, there is resistance to upward and downward movement even before price reaches the trendlines of the wedge pattern. Another critical support level to throw into the mix being 1.0923, the price which GBPUSD clipped on Wednesday 12th October, before bouncing with some vigour.
Short positions
- Entry Level 1: 1.13360 – Region of the upper resistance trendline of sideways wedge pattern.
- Price Target 1: 1.1000 – Round number price level in the region of the supporting trendline of the sideways wedge pattern.
- Price Target 2: 1.0923 – Price low of Wednesday 12th October. Price level which has provided both resistance and support in previous sessions.
- Stop Loss: > 1.14958 – Price high of Wednesday 8th October.
Long positions
- Entry Level 1: 1.1222 – The week beginning 17th October has been marked by GBPUSD tracking the 20 and 50 SMAs on the Hourly Price Chart. Long positions entered into using the 20 SMA could benefit from upward momentum based on a relief rally.
- Price Target 1: 1.13360 – Region of the upper end of sideways wedge pattern.
- Price Target 2: 1.13807 – Price high of last week printed on 13th October.
- Stop Loss: < 1.0923 – Price low of Wednesday 12th October. Key support level.
EURUSD
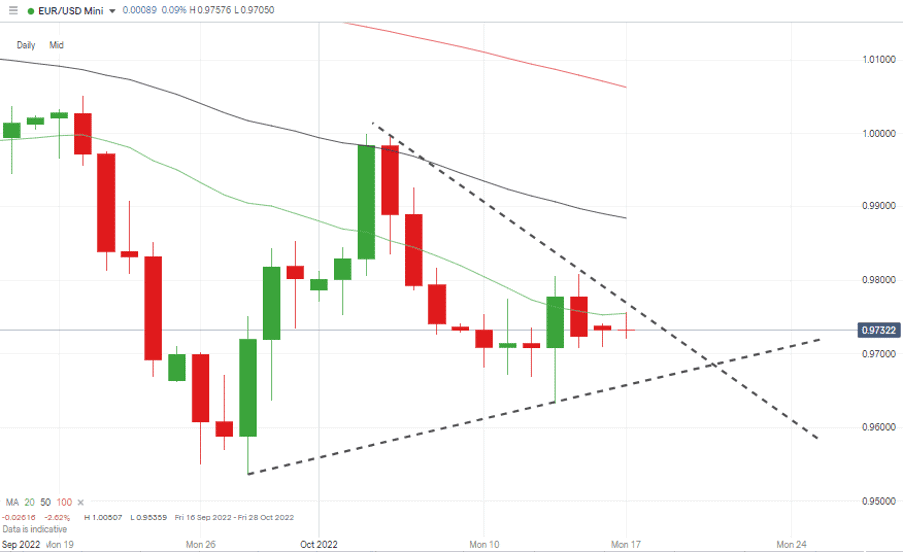
The long-term prognosis for EURUSD remains bearish, and last week’s US CPI report suggests that US interest rate rises could continue to outstrip those of the ECB. The euro’s ability to hold up and trade sideways rather than downwards is an interesting move which, as with GBPUSD, has resulted in the formation of a wedge pattern.
EURUSD Chart – Daily Candles – Sideways Wedge Pattern Forming
Source: IG
With a quieter news week ahead, there is potential for EURUSD to continue its sideways course into the funnel of the wedge pattern. The Hourly Price Chart marking 0.9800 as the upper end of the trading range and 0.9670 as the lower limit.
EURUSD Chart – Hourly Candles – Trading Range
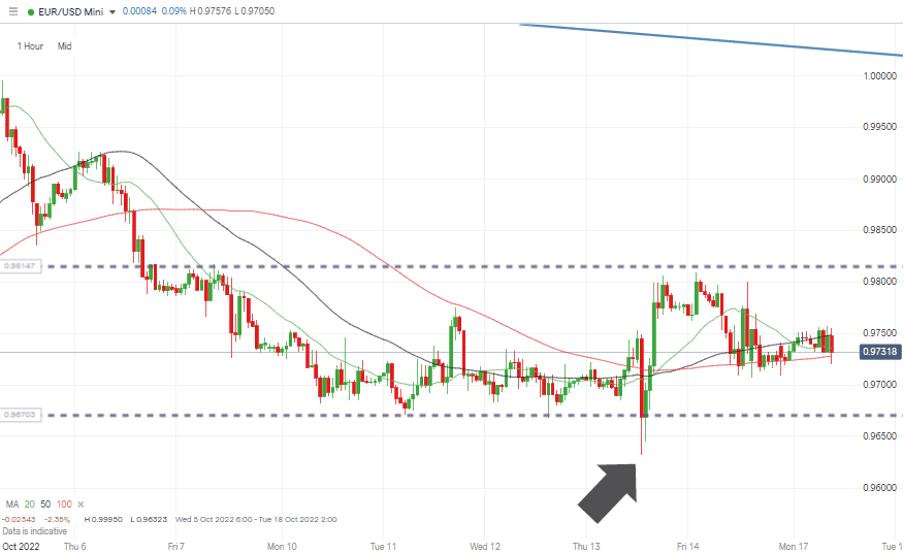
Source: IG
The intra-day price dip to 0.96323 at 13.00 (BST) on Thursday 13th October, followed the release of the CPI data. While price could retest these levels, the bounce off that support points to it being an appropriate level at which to consider placing stop losses on long positions.
Short positions
- Entry Level 1: 0.97551 – Region of the 20 SMA on the Daily Price Chart.
- Price Target 1: 0.9670 – Lower end of sideways trading pattern.
- Price Target 2: 0.95359 – Analysis points to range-bound trading being the dominant feature this coming week, but a breakout to the downside could result in a test of the year-to-date price low of Wednesday 28th September.
- Stop Loss: > 0.9800 – Upper resistance trendline of sideways channel. Tested on Thursday 13th and Friday 14th October and on each occasion rebuffed any further upwards price move
Long positions
- Entry Level 1: 0.97286 – Region of the 100 SMA on the Hourly Price Chart.
- Price Target 1: 0.9775 – Region of the upper resistance trendline of the sideways wedge pattern.
- Price Target 2: 1.0000 – In extension, parity price level.
- Stop Loss: < 0.96323 – Price low of the week commencing 10th October 2022.
Indices
NASDAQ 100
Earnings season steps up a gear this week with bellwether stocks such as Tesla and IBM reporting. The procession of financial statements is always eagerly anticipated. That is even more the case after stocks have experienced a nine-month-long slide in value.
NASDAQ 100 Chart – Daily Candles – Double-bottom?
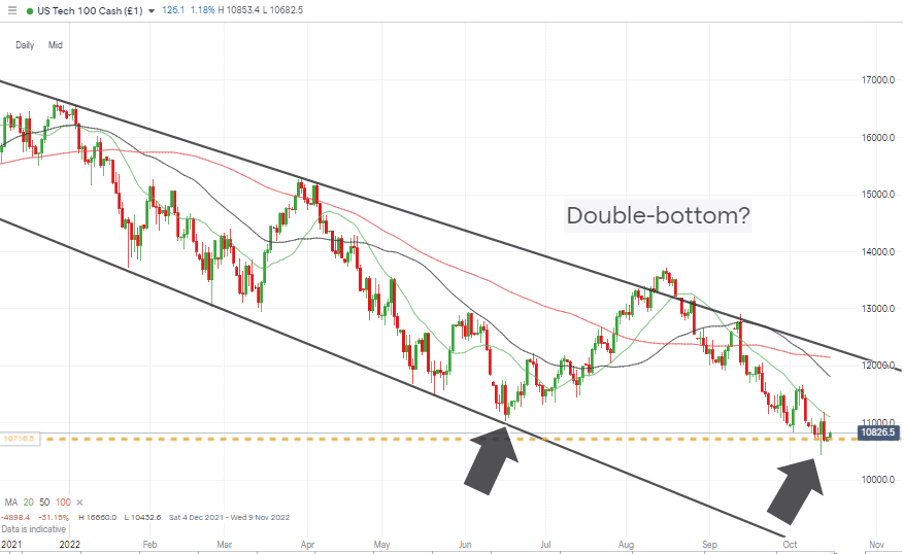
Source: IG
Inflation and interest rates are still the dominant price drivers in stock markets. Still, analysts will be studying the corporate reports for any signs that stocks may, at current price levels, be undervalued.
Upcoming Highlights of the Reporting Calendar:
- Monday 17th October: Rio Tinto, Bank of America
- Tuesday 18th October: Goldman Sachs, Netflix, United Airlines
- Wednesday 19th October: Tesla, IBM, Procter & Gamble
- Thursday 20th October: Snap, American Airlines, Whirlpool
- Friday 21st October: American Express, Verizon
NASDAQ 100 Chart – Hourly Candles – Converging SMAs and Key Support
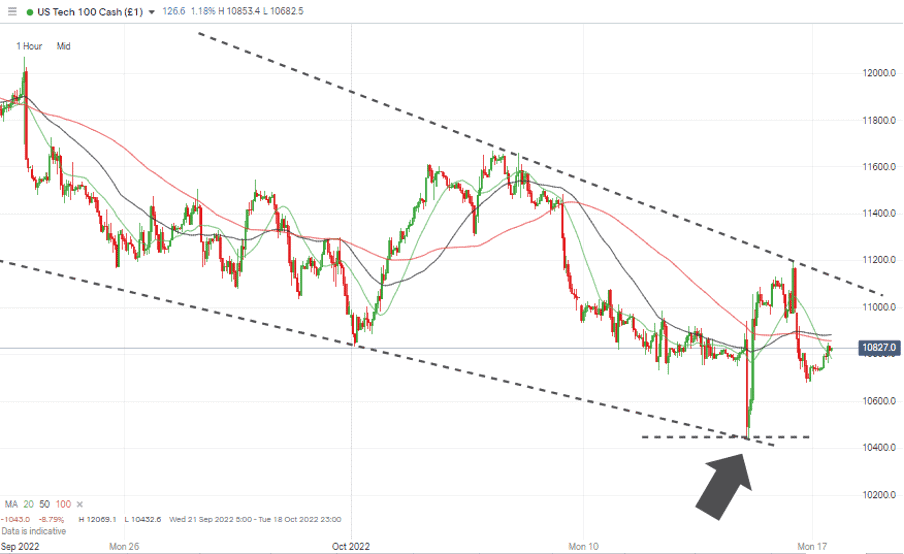
Source: IG
Short positions
- Entry Level 1: 11,107 – Selling into any strength which takes price into the region of the 20 SMA on the Daily Price Chart.
- Price Target 1: 10,432 – Year to date price low printed on Thursday 13th October.
- Price Target 2: 10,000 – Psychologically important price level.
- Stop Loss: >11,150 – Upper resistance trendline of sideways wedge pattern.
Long positions
- Entry Level 1: 10,680 – Price low of Friday 14th October. Now a swing-low of an upward trend that started on Thursday 13th October. For as long as that price level holds, there is hope for the bulls that earnings season could act as a catalyst for an upside breakout.
- Price Target 1: 10,884 – Region of the 50 SMA on the Hourly Price Chart.
- Price Target 2: 11,000 – In extension, round number price level and just below the upper resistance line of the sideways wedge pattern.
- Stop Loss: < 10,432 – Year to date price low printed on Thursday 13th October.
Crypto – Bitcoin & Ethereum
Bitcoin and ether both posted small week-on-week losses as they continue to trend sideways following key SMAs. Bitcoin’s 2.99% price slide was partially matched by ether’s 1.37% fall in value, but in relation to the historical price volatility of both, price moves reflect the coins’ treading water.
Those looking for things to hot up will note the convergence of key SMAs on the Daily Price Chart. Both cryptos have recently tracked the 20 SMA with sporadic price surges coming unstuck when presented by the resistance of the longer-term 50 SMA. With the 20 and the 50 gradually coming together, the question is which of the key metrics price decides to track.
Bitcoin Price Chart – Daily Candles – Tracking 20 SMA
![]()
Source: IG
Bitcoin Long positions
- Entry Level 1: 19,407 – Region of the 20 SMA on the Daily Price Chart. A break above this metric could signify a breakout pattern forming.
- Price Target 1: 19,698 Region of 50 SMA on Daily Price Chart, which can be expected to offer resistance.
- Price Target 2: 20,000 – In extension, psychologically important price level.
- Stop Losses: < 17,604 – Year-to-date price low printed on 18th June 2022.
Ethereum
Ethereum Chart – Daily Candles – Tracking 20 SMA
![]()
Source: IG
Ethereum Long positions
- Entry Level 1: 1,318 – Region of the 20 SMA on the Daily Price Chart.
- Price Target 1: 1,435 – Region of the 50 SMA on the Daily Price Chart and close to psychologically important $15k price level.
- Stop Losses: < 880 – Price low of 17th June 2022.
Risk Statement: Trading financial products carries a high risk to your capital, especially trading leverage products such as CFDs. They may not be suitable for everyone. Please make sure that you fully understand the risks. You should consider whether you can afford to take the risk of losing your money.

Forextraders' Broker of the Month
BlackBull Markets is a reliable and well-respected trading platform that provides its customers with high-quality access to a wide range of asset groups. The broker is headquartered in New Zealand which explains why it has flown under the radar for a few years but it is a great broker that is now building a global following. The BlackBull Markets site is intuitive and easy to use, making it an ideal choice for beginners.