
FOCUS ON: US Jobs Data Takes Heat Out of Stocks, But Risk-on Forex Pairs Continue Upward Trend
- US Non-farm Payroll employment data released on Friday surprised to the upside
- A rapid reappraisal of Fed interest rate policy led to analysts thinking the hawkish policy might continue for some time
- Stocks gave up ground at the prospect of higher US interest rates, but GBPUSD and EURUSD continued their upward trend.
The US Non-farm Payroll numbers released on Friday 2nd December were somewhat above analyst expectations. In November, the number of new hires was 263,000, smashing the predicted number of 200,000.
That left major stock indices such as the S&P 500 and NASDAQ 100 at one point on Friday, trading down on the week, before a late rally helped them clamber into positive territory. That ‘up-week’ resulted from bullish momentum during Monday, Tuesday, and Wednesday in anticipation of the NFP number rather than the NFP number itself.
For currencies, the strong US jobs report was of secondary importance to news that China might be about to pivot on its Zero-covid policy. Suggestions that the world’s second-largest economy might open up for business sparked a rush into risk-on currencies.
The euro hit a five-month high, and GBPUSD and EURUSD posted weekly gains of 1.54% and 1.30%, respectively. Asian currency pairs are the markets to head to for those running strategies which require higher volatility. USDJPY’s weekly move was -2.02%.
US Dollar Basket Chart – Daily Candles – Break of Fib Retracement Support
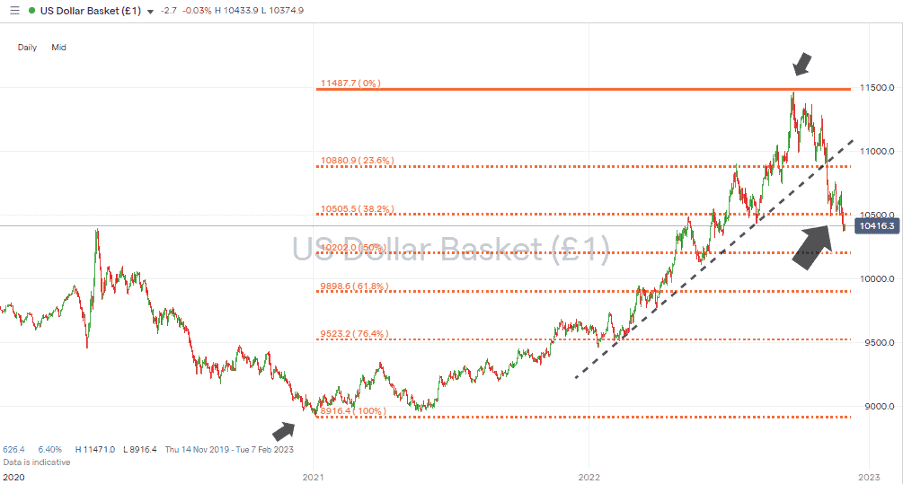
Source: IG
Also read: What is the USD Index?
The prospect of the next interest rate announcement by the US Federal Reserve on 14th December is expected to overshadow the markets to some extent. However, more immediate news can also be expected to trigger price moves.
The Reserve Bank of Australia releases its interest rate announcement at 3.30 am (GMT) on Tuesday 6th December, and the Bank of Canada does the same at 3 pm (GMT) on Wednesday 7th. Other data points to look out for include the US non-manufacturing PMI number due at 3 pm (GMT) on Monday 5th December.
Instrument | Price | Hourly | Daily |
EUR/USD | 1.0542 | Neutral | Strong Buy |
GBP/USD | 1.0746 | Sell | Strong Buy |
USD/JPY | 143.68 | Strong Buy | Strong Sell |
S&P 500 | 3,702 | Strong Buy | Strong Buy |
NASDAQ 100 | 11,351 | Strong Buy | Strong Buy |
FTSE100 | 7,055 | Strong Buy | Strong Buy |
Gold | 1,647 | Sell | Strong Buy |
Crude Oil WTI | 78.21 | Strong Sell | Neutral |
Bitcoin | 18,809 | Strong Buy | Strong Buy |
Ethereum | 1,298 | Strong Buy | Strong Buy |
UTC: 09:26
Our trading signal analysis is based on a comprehensive summary of market data. We use a range of metrics with weighting given to simple and exponential moving averages and key technical indicators.
We created this Weekly Tips section to share possible trade entry and exit points based on our technical analysis. We also have other methods to validate our trades which we can’t publicly share that help to increase their success. All our trades include entry and at least one target price. Stop losses are applied at the reader’s discretion. Our strategies typically trade with a wide stop loss, and risk is further mitigated by trading in small sizes.
Forex
GBPUSD
The potential for a short-term pullback in GBPUSD was identified in the Weekly Forex Trading Tips report of 28th November. By Wednesday, the currency pair had softened to trade at a weekly low of 1.19005, but the 1.90 round number support level held and acted as a platform for continued upward movement into the week’s close.
Our short strategy idea failed to reach Price Target 1 (1.8213), but those trading with the longer-term upward trend through the course of the week would have clipped both Price Target 1 (1.21537) and Price Target 2 (1.22934).
GBPUSD Chart – Daily Candles – Buy the Dips
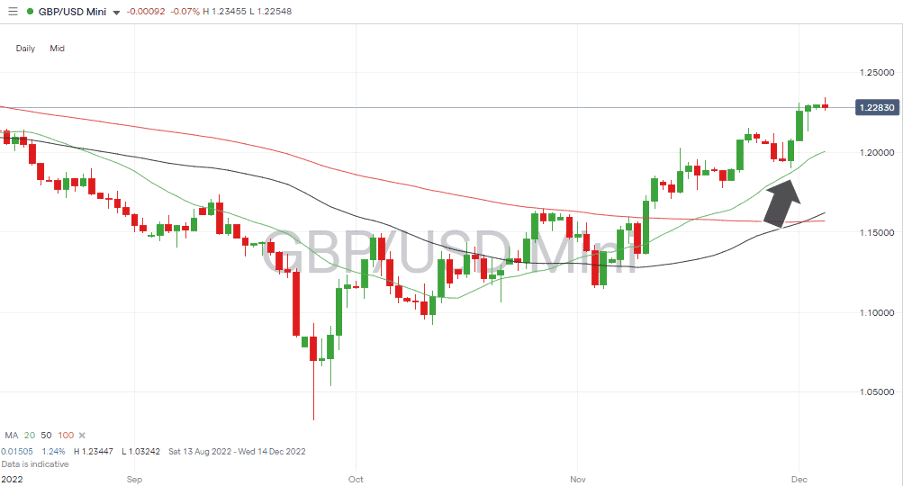
Source: IG
With little UK-specific news due to be released this week, it could be a case of looking for pullbacks that offer opportunities to buy into the underlying upward trend.
GBPUSD Chart – Hourly Candles – 50 SMA Approaching 1.230
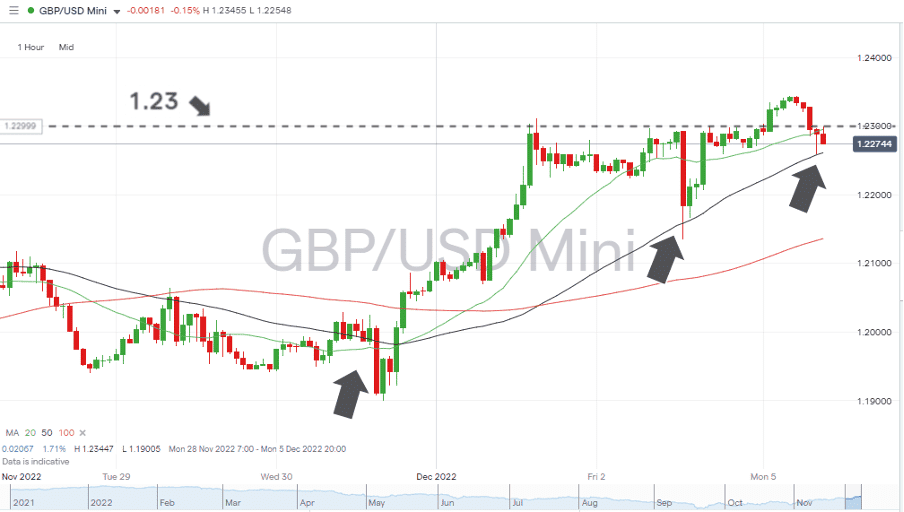
Source: IG
The 50 SMA on the Hourly Price Chart has, since the morning of Wednesday 30th November, proven to be a reliable indicator for long position entry points. That metrics convergence with the 1.23 psychologically important price level looks set to trigger some kind of a reaction as critical support and resistance metrics collide.
Short positions
- Entry Level 1: 1.22618 – Region of the 50 SMA on the Hourly Price Chart. A confirmed break of this support level would open the door to further downward movement.
- Price Target 1: 1.21537 – Price high of Thursday 24th November 2022.
- Price Target 2: 1.20066 – Region of 20 SMA on Daily Price Chart and huge ’round number’ support level.
- Stop Loss: > 1.2300 – Psychologically important ’round number’ price level has acted as resistance since Wednesday 30th November.
Long positions
- Entry Level 1: 1.22618 – Region of the 50 SMA on the Hourly Price Chart. Using the same metric for long positions as for short ones. Buying into any weakness which reaches this level.
- Price Target 1: 1.22934 – In extension. Price high of 1st August 2022. Just below the psychologically important 1.2300 price level.
- Price Target 2: 1.23911 – Region of the 50 SMA on the Weekly Price Chart.
- Stop Loss: < 1.2000 – Round number support level.
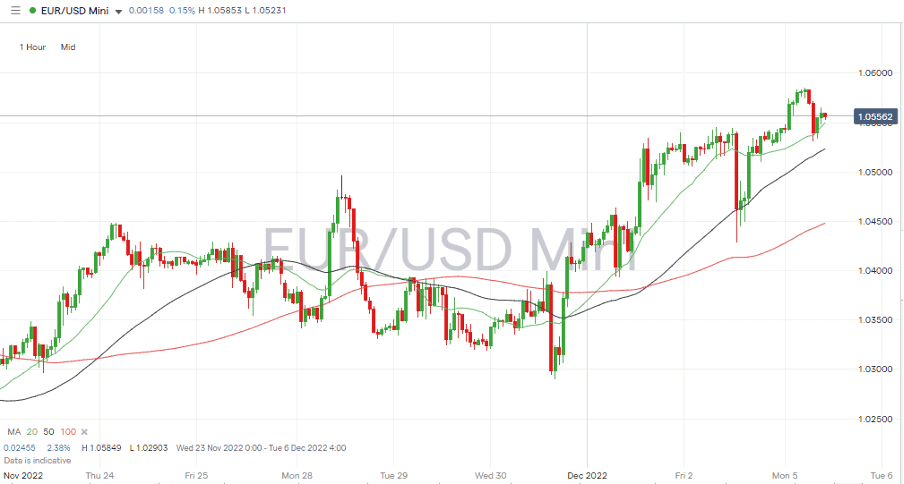
EURUSD
The euro’s breakout through parity and beyond was triggered by ‘dovish’ noises from the US Fed and is receiving further support from events in China. Reports that the Beijing government might be scaling back its Covid-triggered lockdowns means that renewed economic activity could be about to kick-start a move into risk-on currency pairs.
Now printing above 1.055, EURUSD is trading at price levels not seen since June, and the path of least resistance appears to be upward.
EURUSD Chart – Daily Candles – Breakout
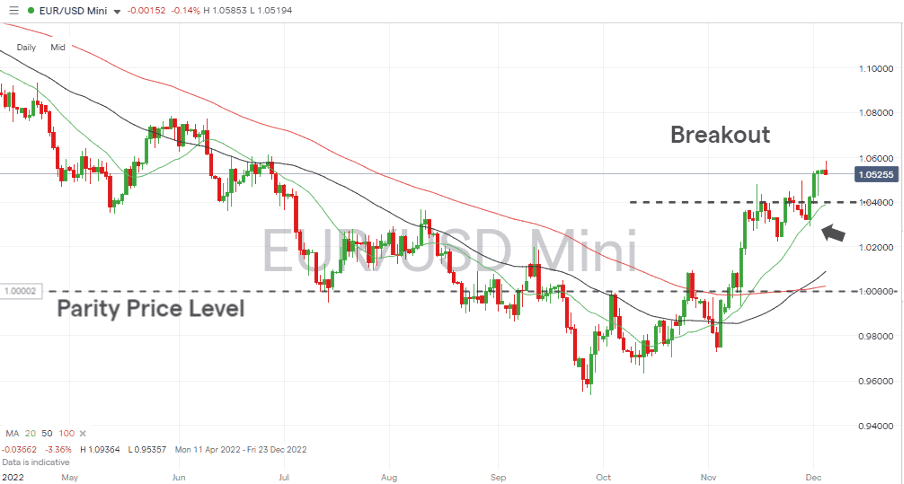
Source: IG
The upward momentum is backed by price trading above the 20, 50 and 100 SMAs on both the Daily and Hourly Price Charts but spotting long-position trade entry points is not easy. Short-term price dips have found support at various support levels, so averaging into positions may be the best approach for those looking to go long.
EURUSD Chart – Hourly Candles – Variety of Support Levels Trigger Bounce
Source: IG
As with the UK, there is little Eurozone news due this week. Price action looks set to respond to news from China and any guidance offered by Jerome Powell about how the FOMC meeting of 14th December might pan out.
Short positions
- Entry Level 1: 1.0600 – Round number price level – positioned just below two key metrics.
- Price Target 1: 1.0400 – Round number support level, which acted as resistance between 15th and 30th November.
- Price Target 2: 1.03895 – Region of 20 SMA on Daily Price Chart.
- Stop Loss: > 1.061 – 38.2% Fib retracement level of the downward price move between 7th January and 27th September 2022. Also close to the price high of 1.0615 on 27th June 2022.
Long positions
- Entry Level 1: 1.0400 – With price bouncing off a variety of support indicators, a patient strategy of waiting for a more significant pullback opens up the door to enter into long positions in the region of 1.0400. This is a psychologically important price level in the region of the 20 SMA on the Daily Price Chart (1.03895).
- Price Target 1: 1.0500 – Round number resistance level.
- Price Target 2: 1.05849 – Intraday price high of Monday 5th December.
- Stop Loss: < 1.02903 – Price low of 30th November. Important ‘swing-low’ price level of an upward trend dating back to 4th November.
Indices
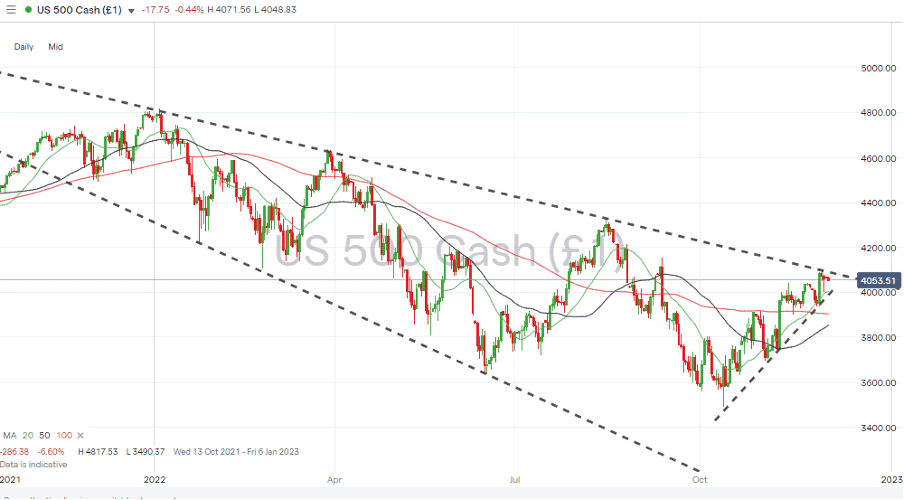
S&P 500
The positive employment news from the US triggered a sell-off in stocks as investors braced for the US Fed to continue its ‘tough medicine’ approach. Growth stocks were worst hit by the prospect of interest rates staying higher for longer, and the Santa Rally, for now at least, looks to be taking a breather.
S&P 500 Chart – Daily Candles – Wedge Pattern Forming
Source: IG
Price is now approaching the significant resistance offered by the multi-month downward trendline, which dates back to the start of the year. Either that resistance level or the more recent upward trendline will need to give in the near future.
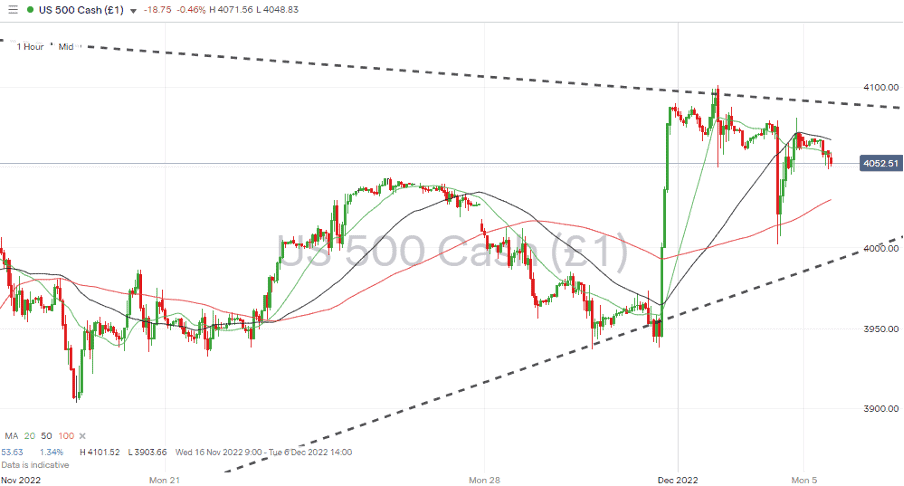
S&P 500 Chart – Hourly Candles
Source: IG
Short positions
- Entry Level 1: 4,090 – Region of the multi-month downward trendline.
- Price Target 1: 4,030 – Region of the 100 SMA on the Hourly Price Chart. Mid-range of the forming wedge pattern.
- Price Target 2: 4,000 – Hugely significant psychological support level and region of the supporting trendline of the November rally.
- Stop Loss: > 4,100 – Above round number resistance and the 4,101-price high of Thursday 1st December.
Long positions
- Entry Level 1: 4,101 – 3,916 – Applying a breakout strategy. Looking for momentum to build and a solid run-in to the year-end should price break above the current December price high.
- Price Target 1: 4,134 – Region of the 50 SMA on the Weekly Price Chart.
- Price Target 2: 4,244 – Region of the 20 SMA on the Monthly Price Chart.
- Stop Loss: < 4,000 – Region of the supporting trend line of the November rally and the 4k round number price level support.
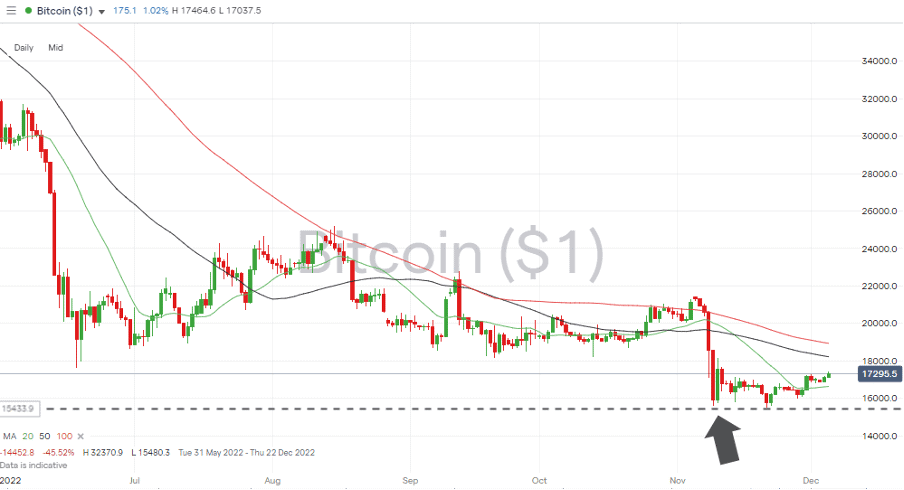
Crypto – Bitcoin & Ethereum
Historical data points to cryptos often posting a positive return in December, and last week’s price jumps in Bitcoin and Ether will offer hope for investors following the FTX crisis. BTC posted a 6.95% week-on-week price gain, and ETH ended the week up 11.19%.
Bitcoin Price Chart – Daily Candles – Support From YTD Low
Source: IG
Bitcoin Long positions
- Entry Level 1: 16,630 – Buying into any price weakness using the 20 SMA on the Daily Price Chart.
- Price Target 1: 18,217 – Region of the 50 SMA on the Daily Price Chart.
- Price Target 2: 20,000 – In extension, psychologically important price level.
- Stop Losses: < 15,480 – Year to date price low printed on Monday 21st November.
Ethereum
Ethereum Chart – Daily Candles – Above 20 SMA
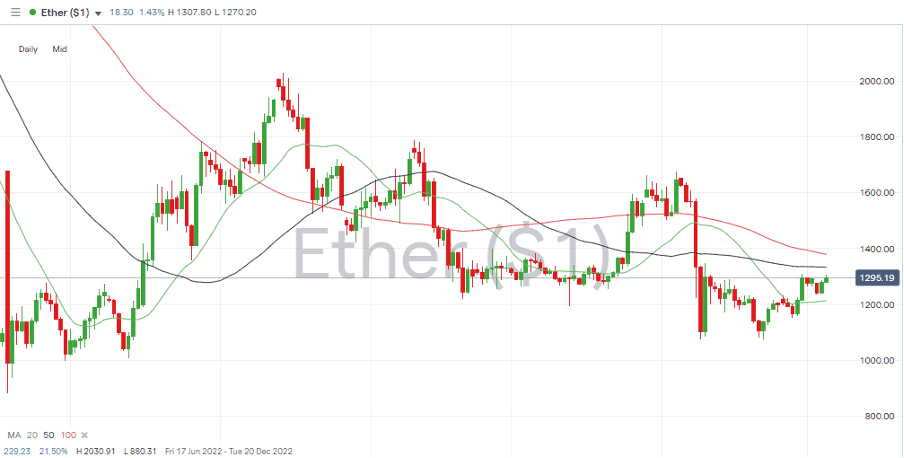
Source: IG
Ethereum Long positions
- Entry Level 1: 1,213 or 1,334 – Using the 20 or 50 SMA on the Daily Price Chart.
- Price Target 1: 1,379 – Region of the 100 SMA on the Daily Price Chart and 1,400 price bar.
- Price Target 2: 1,676 – Price high of 4th November 2022.
- Stop Losses: < 880.31 – Year to date price low printed on 18th June.
Risk Statement: Trading financial products carries a high risk to your capital, especially trading leverage products such as CFDs. They may not be suitable for everyone. Please make sure that you fully understand the risks. You should consider whether you can afford to take the risk of losing your money.

Forextraders' Broker of the Month
BlackBull Markets is a reliable and well-respected trading platform that provides its customers with high-quality access to a wide range of asset groups. The broker is headquartered in New Zealand which explains why it has flown under the radar for a few years but it is a great broker that is now building a global following. The BlackBull Markets site is intuitive and easy to use, making it an ideal choice for beginners.