
FOCUS ON: US Jobs Data Set to Trigger Next Move
- After a shortened week due to the Thanksgiving holiday, markets look poised to make their next move.
- US Non-farm Payroll employment data due on Friday appears to be the most likely catalyst of the next move.
- Dollar reversal has been followed by a period of price consolidation, but that looks set to change.
The US Non-farm Payroll numbers, due to be released on Friday 2nd December, look set to be the major news event of the week. The reversal in the US dollar’s upward price trend is still in its formative stages, and a news-inspired short-term pullback to key resistance/support levels could be possible.
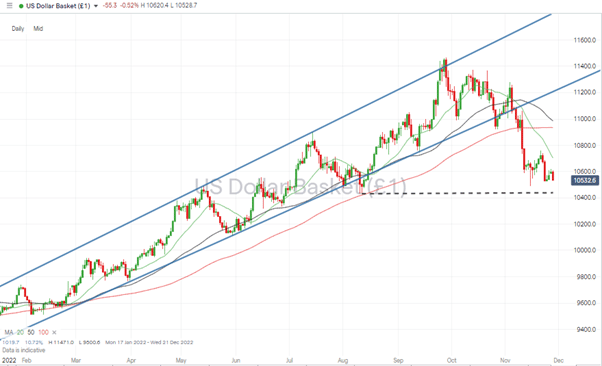
November’s switch from the security of the dollar back into risk-on currencies was triggered by US inflation data suggesting price rises might be losing momentum. While a more dovish stance by the US Fed is yet to be confirmed, that CPI data was sufficient for the US Dollar Basket index to break out of its upward price trend.
The other side of that coin is that a demand reduction may be followed by a fall in employment levels. Friday’s NFP number will give an important steer on how US corporations are reacting to the Fed’s interest rate hikes and if the economy is heading for a soft or hard landing.
From a technical perspective, further weakness in the US Dollar Basket index requires a break of the support formed by the price low of 104.31 printed on 11th August 2022. A higher-than-expected unemployment level is likely to offer extra weight to that downward move, assuming that traders will take the view that the Fed will have to relax its monetary policy to support the economy.
US Dollar Basket Chart – Daily Candles – Consolidation After Break Of Trendline Support
Source: IG
Also read: What is the USD Index?
The Non-farm Payroll number will be released at 8.30 EST on Friday 2nd November.
Other key data points to look out for include the following:
Tuesday 29th November:
- German CPI (November, preliminary)
- US consumer confidence (November)
Wednesday 30th November:
- China Manufacturing & Non-Manufacturing PMI (November)
- Germany unemployment (November)
- US GDP (Q3, 2nd estimate)
Thursday 1st December:
- US ISM Manufacturing PMI (November)
Instrument | Price | Hourly | Daily |
EUR/USD | 1.0407 | Buy | Strong Buy |
GBP/USD | 1.2079 | Strong Buy | Strong Buy |
USD/JPY | 137.93 | Strong Sell | Strong Sell |
S&P 500 | 4,011 | Strong Buy | Strong Buy |
NASDAQ 100 | 11,702 | Buy | Strong Buy |
FTSE100 | 7,448 | Neutral | Strong Buy |
Gold | 1,757 | Strong Buy | Strong Buy |
Crude Oil WTI | 73.85 | Strong Sell | Strong Sell |
Bitcoin | 16,194 | Strong Sell | Strong Sell |
Ethereum | 1,171 | Strong Sell | Strong Sell |
UTC: 09:26
Our trading signal analysis is based on a comprehensive summary of market data. We use a range of metrics with weighting given to simple and exponential moving averages and key technical indicators.
We created this Weekly Tips section to share possible trade entry and exit points based on our technical analysis. We also have other methods to validate our trades which we can’t publicly share that help to increase their success. All our trades include entry and at least one target price. Stop losses are applied at the reader’s discretion. Our strategies typically trade with a wide stop loss, and risk is further mitigated by trading in small size.
Forex
GBPUSD
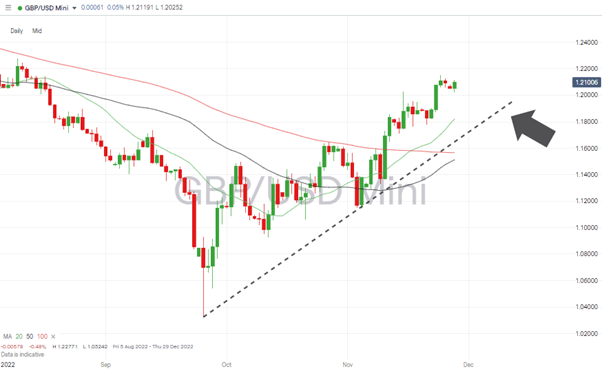
The potential for continued upward momentum in GBPUSD was identified in the Weekly Forex Trading Tips report of 21st November. Cable did post a week-on-week gain of 1.48%, and while the path of least resistance continues to be upward, a short-term pullback can’t be discounted.
The RSI on the Daily Price Chart is at 65.25, which isn’t a sign of being overbought on that time frame. However, the divergence from the 20 Day SMA does indicate the air could be getting thin for the currency pair.
In a quiet news week for the UK economy, a short-term consolidation pattern looks the most likely option for traders, at least until the US jobs numbers are released on Friday.
GBPUSD Chart – Daily Candles – RSI and SMA Divergence
Source: IG
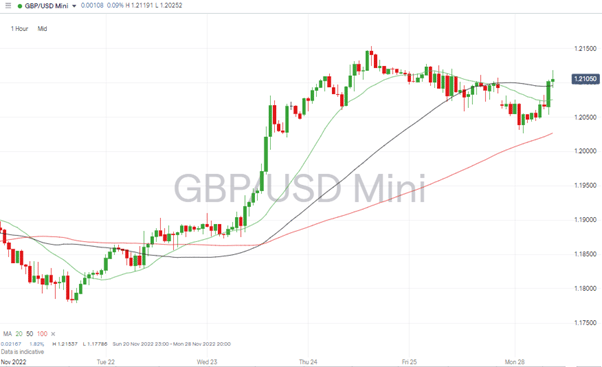
On an hourly basis, the break above the 100 SMA on Tuesday 22nd November, triggered a price surge from 1.18530 to 1.21537. That included a committed move through 1.20 on Wednesday 23rd which means that psychologically important price level now offers support, not resistance. But the move by price to trade below the 100-Hour SMA on Friday 25th points to price potentially running a holding pattern, at least in the short-term.
GBPUSD Chart – Hourly Candles – Break of 1.20
Source: IG
As long as the trendline dating back to Monday 26th September holds, the path of least resistance appears to be upward, with the next significant resistance level being the psychologically important 1.20 price.
Short positions
- Entry Level 1: 1.2000 – With the 20, 50 and 100 SMA’s trading above 1.20 on the Hourly Price Chart, a break of that round number support level would mean the SMAs have also been crossed. That would point to there being further downward momentum.
- Price Target 1: 1.8213 – Region of 20 SMA on the Daily Price Chart.
- Price Target 2: 1.17101 – Weekly price low of 14th November 2022.
- Stop Loss: > 1.20293 – Price high of Tuesday 15th November.
Long positions
- Entry Level 1: 1.2000 – Using the 1.20 price bar as a support level.
- Price Target 1: 1.21537 – Price high of Thursday 24th November 2022
- Price Target 2: 1.22934 – In extension. Price high of 1st August 2022.
- Stop Loss: < 1.1800 – Round number support level and the region of the upward trendline dating from Monday 26th September.
EURUSD
The potential for a move in EURUSD during the first half of the week lies with German CPI data. That is being released on Tuesday, and Germany’s unemployment report for November is due on Wednesday.
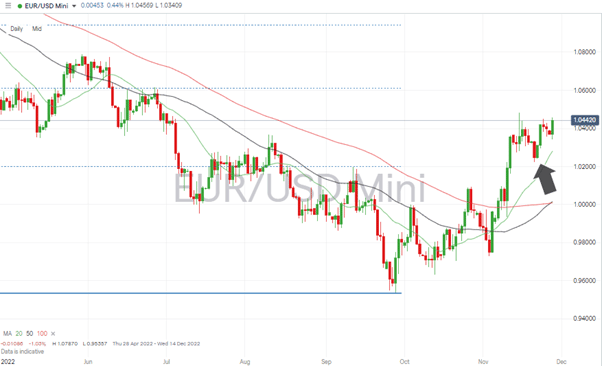
The bullish candlestick pattern on the Daily Price Chart suggests upward momentum is more robust than for GBPUSD. A break of 1.04817, which marks the price high of Tuesday 15th November, would leave room for price to go on and test 1.05
EURUSD Chart – Daily Candles – New Swing Low
Source: IG
Support is now offered by the swing-low of 1.02227 printed on Monday 21st November, and the supporting trendline dates from Thursday 10th November.
EURUSD Chart – Hourly Candles – Trendline Support 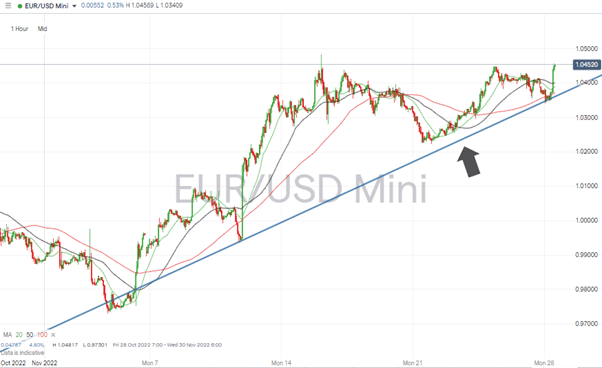
Source: IG
While midweek noise can be expected due to the reports from Germany, the critical number for the Eurodollar market remains the US jobs report due on Friday.
Short positions
- Entry Level 1: 1.0400 – Selling into weakness which takes price below the supporting trendline on the Hourly Price Chart.
- Price Target 1: 1.02812 – Region of the 20 SMA on the Daily Price Chart.
- Price Target 2: 1.000 – Price parity level and the region of the 50 and 100 SMA on the Daily Price Chart. All offer significant price support.
- Stop Loss: > 1.04817 – Price high of Tuesday 15th November.
Long positions
- Entry Level 1: 1.04817 – Price high of Tuesday 15th November. Applying a momentum-based strategy to capture further upward movement.
- Price Target 1: 1.05 – Round number resistance level.
- Price Target 2: 1.061 – 38.2% Fib retracement level of the downward price move between 7th January and 27th September 2022
- Stop Loss: < 1.000 – Region of the 50 and 100 SMA on the Daily Price Chart and the parity price level.
Indices
S&P 500
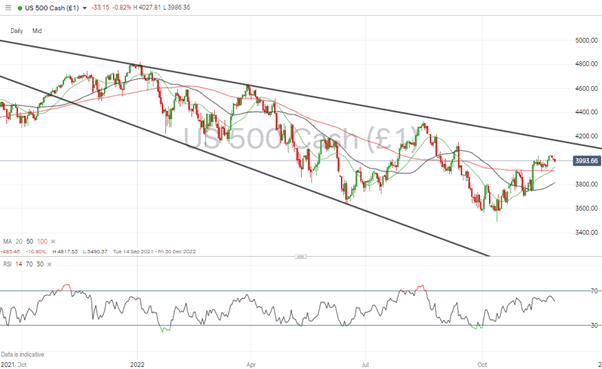
The S&P 500’s price rise from 3,490 to 4,000 has taken more than one month to complete and included 15 down days. That’s not a sign of euphoria gripping the stock markets. With price reaching a key resistance level and the US jobs report due on Friday, there is potential for price to weaken.
The upper trendline of the multi-month downward price channel is that crucial resistance level. It currently sits in the region of 4,160, and a test of that appears unlikely this week as traders sit on their hands waiting for the NFP to be released.
S&P 500 Chart – Daily Candles – Approaching Trendline Resistance
Source: IG
While the mini bull run in US stocks might not have been dramatic, it has been solid. That means that on the Daily Price Chart, price is still in line with the 20 SMA and the RSI is a modest 57.8. That indicates the market is far from being overbought on a daily timeframe.
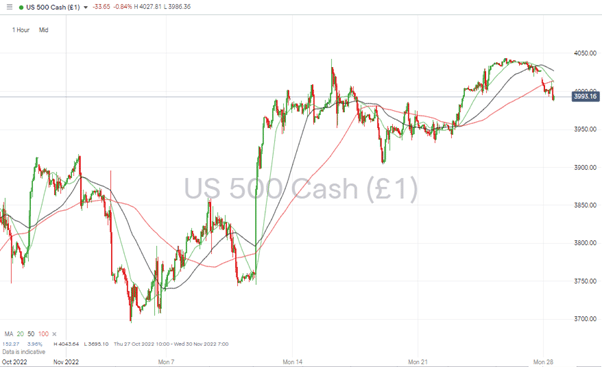
S&P 500 Chart – Hourly Candles
Source: IG
Short positions
- Entry Level 1: 4,000 – Price broke through this psychologically important level on Wednesday 23rd November but has since fallen back to trade below it. Tested repeatedly during the ten days following Monday 14th November, it looks like the metric to watch.
- Price Target 1: 3,946 – Region of the 20 SMA on the Daily Price Chart.
- Price Target 2: 3,910 – Weekly price low printed on 7th November 2022 and region of the 100 SMA on the Daily Price Chart.
- Stop Loss: > 4,160 – Region of upper trendline of the multi-month downward price channel.
Long positions
- Entry Level 1: 3,910 – 3,916 – Buying into any weakness that takes price into the region of the weekly price low printed on 7th November 2022 and the 100 SMA on the Daily Price Chart.
- Price Target 1: 4,000 – Psychologically important price level.
- Price Target 2: 4,198 – Region of the 100 SMA on the Weekly Price Chart and round number resistance near 4,200.
- Stop Loss: < 3,695 – Swing low price pattern printed on 3rd November.
Crypto – Bitcoin & Ethereum
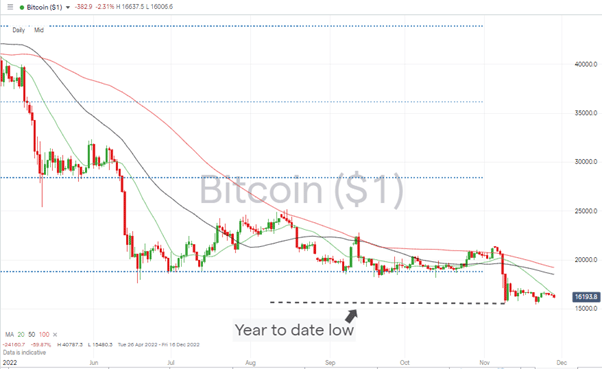
The crisis of confidence caused by the collapse of FTX has moved from the trading floor to the courtrooms. With investigators and authorities trying to locate missing funds, attention has turned to whether the selloff in Bitcoin and Ether was overdone.
The prices of both coins have stabilised, with Bitcoin and Ether posting week-on-week gains of 1.33% and 4.65%, respectively. That doesn’t remove the threat of them testing key support levels, but at current price levels, the crypto sector’s life support machine does appear to be operating effectively.
Bitcoin Price Chart – Daily Candles – Support From YTD Low
Source: IG
- Bitcoin Long positions
- Entry Level 1: 16,527 – Region of 20 SMA on the Daily Price Chart. Year-to-date price low printed on Wednesday 9th November.
- Price Target 1: 18,525 – Region of the 50 SMA on the Daily Price Chart.
- Price Target 2: 20,000 – In extension, psychologically important price level.
- Stop Losses: < 15,585 – Year to date price low printed on Wednesday 9th November.
Ethereum
Ethereum Chart – Daily Candles – 20 SMA
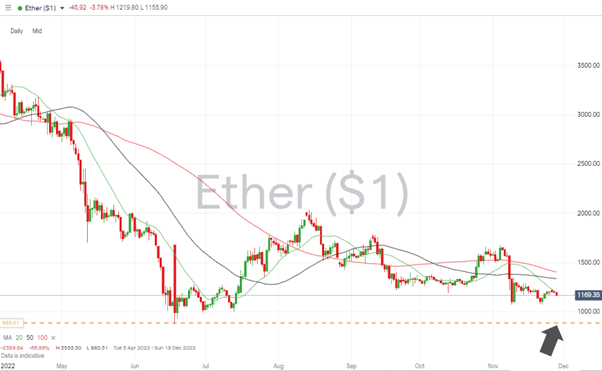
Source: IG
Ethereum Long positions
- Entry Level 1: 1,200 – Buying into strength when price breaks the 1,200 round number price level, which is also in the region of the 20 SMA on the Daily Price Chart.
- Price Target 1: 1,404 – Region of the 100 SMA on the Daily Price Chart and 1,400 price bar.
- Price Target 2: 1,676 – Price high of 4th November 2022.
- Stop Losses: < 880.31 – Year to date price low printed on 18th June.
Risk Statement: Trading financial products carries a high risk to your capital, especially trading leverage products such as CFDs. They may not be suitable for everyone. Please make sure that you fully understand the risks. You should consider whether you can afford to take the risk of losing your money.

Forextraders' Broker of the Month
BlackBull Markets is a reliable and well-respected trading platform that provides its customers with high-quality access to a wide range of asset groups. The broker is headquartered in New Zealand which explains why it has flown under the radar for a few years but it is a great broker that is now building a global following. The BlackBull Markets site is intuitive and easy to use, making it an ideal choice for beginners.