
FOCUS ON: Divergence Points to Interesting Start of 2023
- Divergence in risk appetite in forex and stock markets
- GBPUSD and EURUSD hold firm while stocks weaken during the final sessions of 2022
- Realignment requires sterling and euro to weaken or stocks to rally
The holiday season has, as expected, been associated with lower trade volumes and a degree of sideways trading in the markets. That rudderless price action has resulted in a disconnect between stocks and risk-on currency pairs, which sets the scene for an interesting start to 2023.
While stock indices have weakened in the run into the year-end, GBPUSD and EURUSD have shown some resilience and held on to the gains they made in early December. The notable absence of a Santa Rally in stocks led to risk appetite in the two asset groups diverging.
From a macro perspective, a realignment of the two sectors could be expected, with the question being if sterling and the euro will decline in value or stocks will rebound on the back of new year enthusiasm.
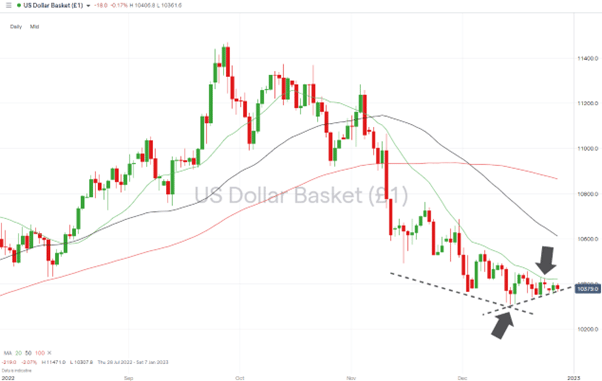
US Dollar Basket Chart – Daily Candles – 20 SMA Guiding Price Downwards
Source: IG
Also read: What is the USD Index?
Technical indicators in the US Dollar Basket index suggest that further weakening in the dollar might be imminent. The upward trendline, which dates back to the low of 103.07 on December 14th 2022, can be attributed to quiet Christmas markets, and the downward channel continues to appear to be the primary guiding indicator.
Factor in that price has not closed above the 20 SMA on the Daily Price Chart since 3rd November 2022, and bearish price movement appears to be the most likely option. Until the resistance provided by the 20 SMA is broken, a retest of 103.07 would be a sensible target for those looking to sell the dollar.
Instrument | Price | Hourly | Daily |
EUR/USD | 1.0647 | Strong Buy | Strong Buy |
GBP/USD | 1.2078 | Strong Buy | Neutral |
USD/JPY | 133.78 | Neutral | Strong Sell |
S&P 500 | 3,840 | Neutral | Strong Sell |
NASDAQ 100 | 10,836 | Strong Sell | Strong Sell |
FTSE100 | 7,544 | Strong Buy | Strong Buy |
Gold | 1,803 | Strong Sell | Buy |
Crude Oil WTI | 79.32 | Neutral | Neutral |
Bitcoin | 16,635 | Neutral | Strong Sell |
Ethereum | 1,193 | Strong Sell | Strong Sell |
UTC: 13:22
Our trading signal analysis is based on a comprehensive summary of market data. We use a range of metrics with weighting given to simple and exponential moving averages and key technical indicators.
We created this Weekly Tips section to share possible trade entry and exit points based on our technical analysis. We also have other methods to validate our trades which we can’t publicly share that help to increase their success. All our trades include entry and at least one target price. Stop losses are applied at the reader’s discretion. Our strategies typically trade with a wide stop loss, and risk is further mitigated by trading in small sizes.
Forex
GBPUSD
With few news announcements, the end of 2022 was marked by a period of price consolidation in the GBPUSD currency pair. A revision of the latest UK GDP number confirmed the UK economy had shrunk in the last quarter by 10 basis points more than initially stated. Still, given the challenges facing the economy, that move had minimal impact on price.
Now trading within the range set by the 20 and 50 SMAs on the Daily Price Chart, the Daily RSI of 49.5 further confirms there are no immediate clues as to which way the price of cable will next head.
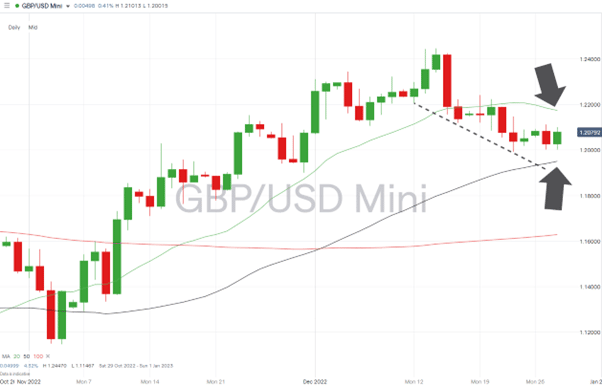
GBPUSD Chart – Daily Candles – Price Consolidation
Source: IG
The case for further weakness in GBPUSD largely stems from the likelihood that the negative GDP figure for Q3 will be followed by another one for Q4, confirming that the UK economy has entered a technical recession.
Support will be offered by the 1.20 ’round number’ price level, and if price can break through the 20 SMA on the Daily Price Chart (currently 1.21742), there is little resistance until the region of 1.24470.
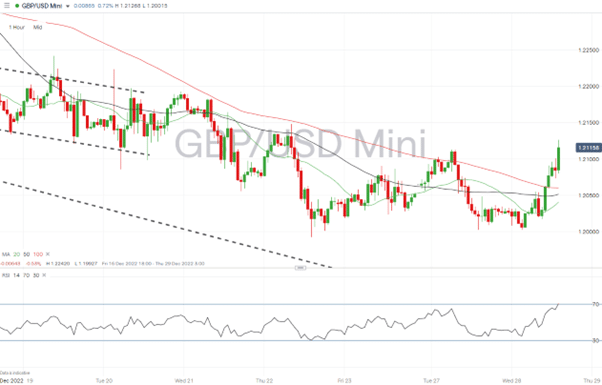
GBPUSD Chart – Hourly Candles – 100 SMA Breakout
Source: IG
Short positions
- Entry Level 1: 1.21761 – Selling into strength which takes price to the region of the 20 SMA on the Daily Price Chart.
- Price Target 1: 1.2000 – Psychologically important ’round number’ price level.
- Price Target 2: 1.19512 – Region of 50 SMA on Daily Price Chart.
- Stop Loss: > 1.24470 – Price high of Wednesday 14th December.
Long positions
- Entry Level 1: 1.19512 – Region of 50 SMA on Daily Price Chart. Recent price action suggests a test/break of 1.20 can’t be discounted.
- Price Target 1: 1.21761 – Selling into strength which takes price to the region of the 20 SMA on the Daily Price Chart
- Price Target 2: 1.2400 – Round number price resistance.
- Stop Loss: < 1.18731 – Swing-low price recorded on 30th November 2022.
EURUSD
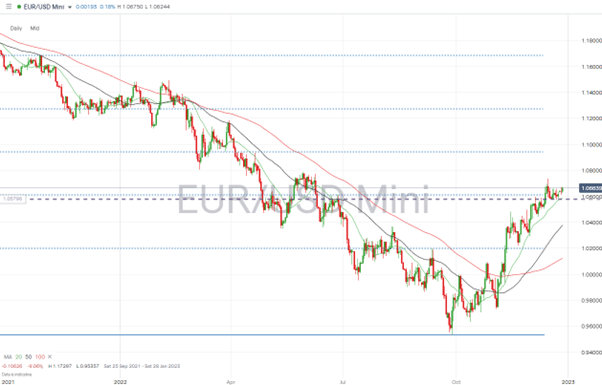
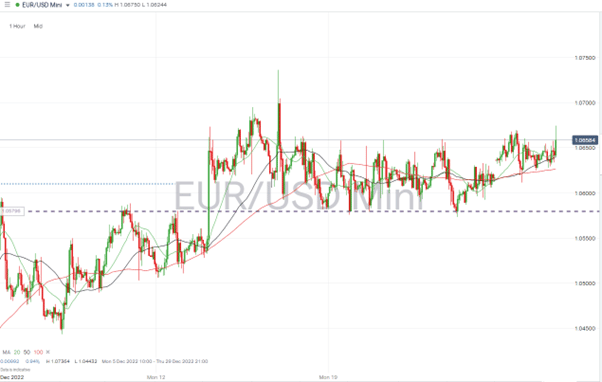
Euro’s bullish price action on the Daily Chart points to the path of least resistance continuing upward. Consolidation in the region of 1.061 ties in with that price level marking the 38.2% Fibonacci retracement of the price fall from January 2021 to September 2022.
Unlike sterling, the euro is on a Daily Price Chart still trading above the 20 SMA, an indicator it hasn’t closed below since 3rd November 2022. While the 20 SMA holds, minor retracements represent opportunities to buy EURUSD, with the price high of 1.07364 printed on 15th December being a plausible price target.
EURUSD Chart – Daily Candles – Price Consolidation at Fib Level
Source: IG
The hourly price chart illustrates how price has traded in a sideways channel in the closing stages of 2022. The support at 1.05796 marked the bottom of the range after being tested and holding firm on three different occasions, including Friday the 9th, Monday the 12th, and Thursday 22nd December 2022.
EURUSD Chart – Hourly Candles
Source: IG
Short positions
- Entry Level 1: 1.07364 – Selling into strength which takes price to the region of the intraday price high of 15th December 2022.
- Price Target 1: 1.061 – 38.2% Fib retracement level of the downward price move between 7th January and 27th September 2022. Also, the price high of 1.0615 on 27th June 2022.
- Price Target 2: 1.0586 – Region of 20 SMA on Daily Price Chart.
- Price Target 3: 1.0400 – Psychologically important support level which acted as resistance between 15th and 30th November. And region of the 50 SMA on the Daily Price Chart (1.03775).
- Stop Loss: > 1.08 – Round number price level.
Long positions
- Entry Level 1: 1.05796 – 1.05866 –Fib retracement resistance/support price level and region of the 20 SMA on the Daily Price Chart.
- Price Target 1: 1.061 – 38.2% Fib retracement level.
- Price Target 2: 1.07364 – Price high of 15th December 2022
- Stop Loss: < 1.05 – Round number price level.
Indices
S&P 500
Equity investors will be looking forward to the chance that a new year brings a change in fortunes. The S&P500, the US flagship stock index, continued its poor streak in December by posting month-to-date losses of as much as 5.02%
Hopes that inflation might be cooling had led to a short-lived rally earlier in the month but hopes of momentum building were quashed by more hawkish guidance from the US Federal Reserve.
S&P 500 Chart – Daily Candles – Return to Trading Channel
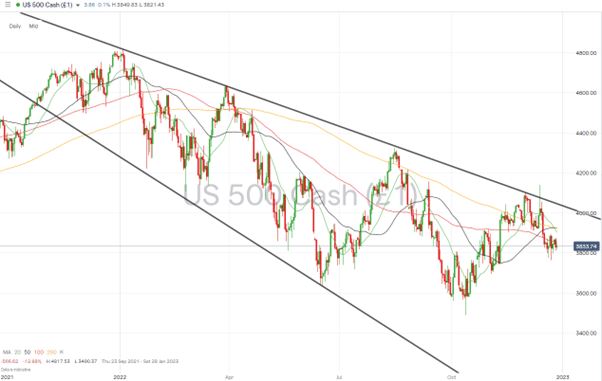
Source: IG
With the S&P500 now trading back in its downward channel, there is a real risk of further losses. Price is currently sitting below the 20, 50, 100, and 200 SMAs on the Daily Price Chart. There is plenty of room for price to slide before it encounters the supporting trendline of the trading range, and the Daily RSI sits in the ‘overbought’ area of its chart at 43.3.
S&P 500 Chart – Hourly Candles
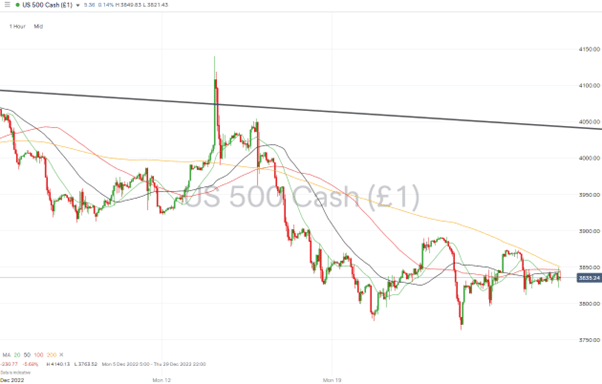
Source: IG
Short positions
- Entry Level 1: 3,854 – Region of the 100 SMA on the Daily Price Chart.
- Price Target 1: 3,590 – Region of 50 SMA on the Weekly Price Chart. Price has closed below that metric only once in the last 10 years.
- Stop Loss: > 3,901 – Region of the 20 SMA on the Monthly Price Chart and psychologically important price level.
Long positions
- Entry Level 1: 3,822– Price closed at this level on 19th and 22nd December 2022. The next day’s trading session registered a green candle on each occasion.
- Price Target 1: 3,901 – Region of the 20 SMA on the Monthly Price Chart and ’round number’ resistance.
- Price Target 2: 3,920 – Region of the 50 and 200 SMA on the Daily Price Chart. The convergence of these two metrics makes them likely to offer significant resistance to upward price movement.
- Stop Loss: < 3,763 – Price low of 22nd December 2022.
Crypto – Bitcoin & Ethereum
The two major cryptos continue to trade at crucial support levels, tracking key SMAs and holding above 2022 year-to-date lows. That consolidation is good news for those predicting a new bull run could be about to take place following a series of bad news events dragging the sector down in 2022.
While price has been holding steady, certain developments at the crypto blockchain networks point towards them moving towards their goal of becoming more mainstream and usable.
Holders of ETH will be pleased to know Visa is working on a solution to allow them to set up automatic payments from self-custodial wallets. That will use some of Ethereum’s well-renowned smart contracts called “delegable accounts” (EIP-86).
Bitcoin investors will be eagerly looking for signs that the US Fed will finally pivot on its interest rate policy. That would lead to a weaker dollar, and as BTC and the dollar are typically negatively correlated, such a change could trigger another Bitcoin rally.
Bitcoin Price Chart – Daily Candles – Trading Below 20 SMA
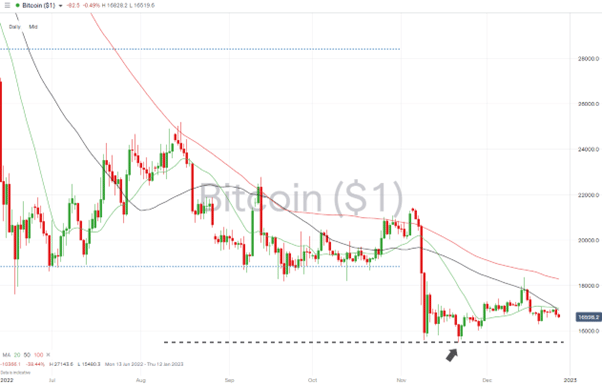
Source: IG
Bitcoin Long positions
- Entry Level 1: 16,905 – Applying a breakout strategy that buys into a price move which breaks through the 50 SMA on the Daily Price Chart.
- Price Target 1: 18,369 – Price high of 14th December 2022 and region of the 100 SMA on the Daily Price Chart.
- Price Target 2: 20,000 – In extension, psychologically important price level.
- Stop Losses: < 15,480 – Year to date price low printed on Monday 21st November.
Ethereum
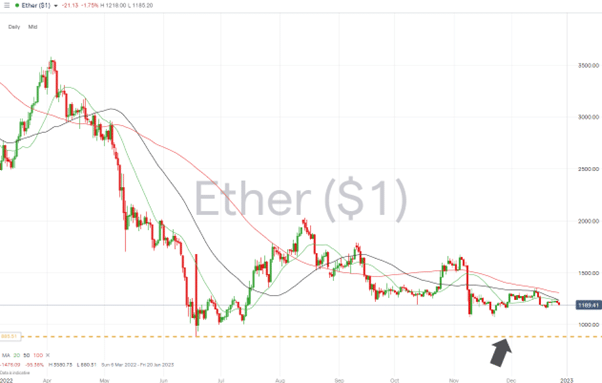
Ethereum Chart – Daily Candles – Trading below 20, 50 and 100, SMA
Source: IG
Ethereum Long positions
- Entry Level 1: 1,235 – Buying into price strength which takes price through the resistance offered by the convergence of the 20 and 50 SMA on the Daily Price Chart.
- Price Target 1: 1,311 – Region of the 100 SMA on the Daily Price Chart.
- Price Target 2: 1,676 – Price high of 4th November 2022.
- Stop Losses: < 880.31 – Year to date price low printed on 18th June.
Risk Statement: Trading financial products carries a high risk to your capital, especially trading leverage products such as CFDs. They may not be suitable for everyone. Please make sure that you fully understand the risks. You should consider whether you can afford to take the risk of losing your money.

Forextraders' Broker of the Month
BlackBull Markets is a reliable and well-respected trading platform that provides its customers with high-quality access to a wide range of asset groups. The broker is headquartered in New Zealand which explains why it has flown under the radar for a few years but it is a great broker that is now building a global following. The BlackBull Markets site is intuitive and easy to use, making it an ideal choice for beginners.