
FOCUS ON: Bullish Sentiment Takes Asset Prices to Key Resistance Levels
- Weeklong surge in investor appetite stalls for US holiday
- Bank of Japan rate decision and UK inflation data to be released this week
- Assets approaching key technical resistance levels
Trading Ideas
We created this Weekly Tips section to share possible trade entry and exit points based on our technical analysis. We also have other methods to validate our trades which we can’t publicly share that help to increase their success. All our trades include entry and at least one target price. Stop losses are applied at the reader’s discretion. Our strategies typically trade with a wide stop loss, and risk is further mitigated by trading in small sizes.
Instrument | Price | Hourly | Daily |
EUR/USD | 1.0806 | Strong Sell | Strong Buy |
GBP/USD | 1.2181 | Strong Sell | Strong Buy |
USD/JPY | 128.70 | Strong Buy | Strong Sell |
S&P 500 | 3,980 | Strong Buy | Strong Buy |
NASDAQ 100 | 11,464 | Strong Buy | Strong Buy |
FTSE100 | 7,847 | Strong Buy | Strong Buy |
Gold | 1,911 | Sell | Strong Buy |
Crude Oil WTI | 79.38 | Sell | Strong Buy |
Bitcoin | 20,733 | Strong Buy | Strong Buy |
Ethereum | 1,536 | Strong Buy | Strong Buy |
UTC: 9:42
US Dollar Basket Index (DXY)
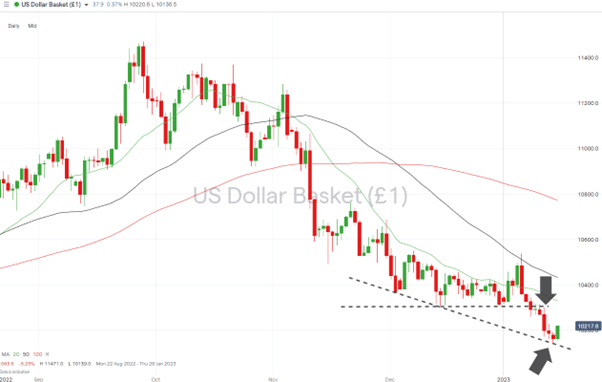
The US Dollar index (DXY) posted six consecutive down days following Friday 6th January, and on intraday charts over that period, gave up 3.57% of its value. While the medium-term prognosis for the dollar is further weakness, there is every chance of a short-term pullback.
The Martin Luther King Day holiday in the US means exchanges are closed on Monday, and lower liquidity in key markets could act as a catalyst for a retracement.
US Dollar Basket Chart – Daily Price Chart – Testing Key Price Support Levels
Source: IG
Also read: What is the USD Index?
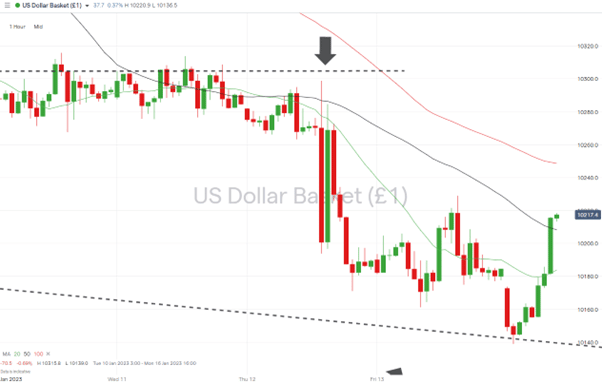
US Dollar Basket Chart – Hourly Price Chart
Source: IG
Short positions
- Entry Level 1: 103.07 – Selling into any price rises which take price to the resistance level which acted as support in December and now acts as resistance. Also, the region of the 20 SMA on the Daily Price Chart.
- Price Target 1: 101.84 – Closing price of 13th January.
- Price Target 2: 101.27 – Support level formed by the trendline dating from 2nd December 2022.
- Stop Loss: > 104.31 – The region of the 50 SMA on the Daily Price Chart acted as resistance to the upward price move of 6th January 2023.
Long positions
- Entry Level 1: 101.27 – With the RSI at 36.5, the US Dollar Basket index is trading in the oversold region of the Daily Price Chart. Chasing the price rally of Monday 16th January may be best left to those trading short-term strategies considering that the US holiday may be acting as the trigger of the move.
- Price Target 1: 102.08 – Region of the 50 SMA on the Daily Price Chart.
- Price Target 2: 105.37 – In extension, price high recorded on Friday 6th January. Current year-to-date high.
- Stop Loss: < 101.10 – Price low formed in the swing-low price pattern of 30th May 2022.
Price has not closed above the 20 SMA on the Daily Price Chart since 3rd November 2022. If that metric continues to act as resistance, then further downward price moves can be expected. Without a break, the path of least resistance continues to appear downward.
GBPUSD
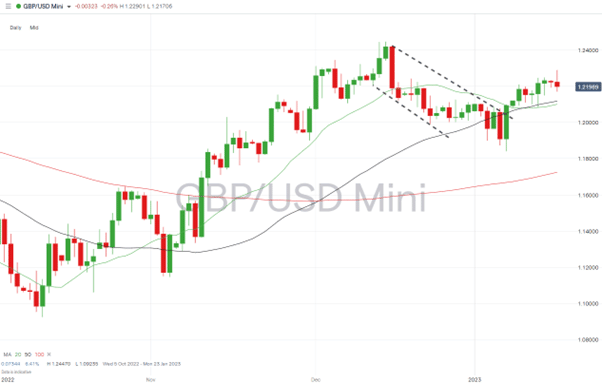
With the RSI on the Daily Price Chart currently registering 56.6, there is room for price to move in either direction.
GBPUSD Chart – Daily Price Chart
Source: IG
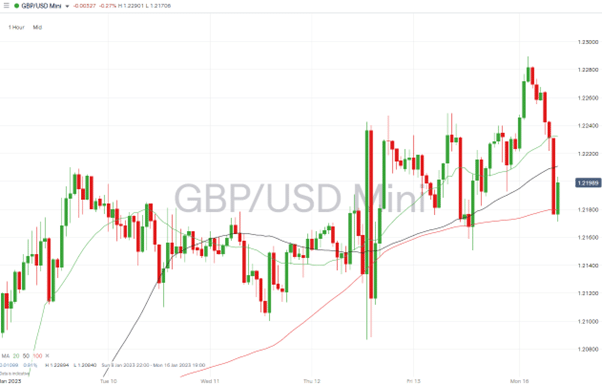
GBPUSD Chart – Hourly Price Chart
Source: IG
Short positions
- Entry Level 1: 1.22894 – Selling into strength which takes price to the year-to-date high recorded on Monday 16th January.
- Price Target 1: 1.22156 – Level of the 61.8% Fibonacci retracement formed by the price fall between 14th December 2022 and 6th January 2023.
- Price Target 1: 1.2100 – Psychologically important ‘round number’ price level. Acted as resistance in the week beginning 9th January.
- Stop Loss: > 1.23041 – 76.4% Fib retracement of the December to January price fall. Also, just above the ‘round number’ resistance which can be expected near the 1.23 price level.
Long positions
- Entry Level 1: 1.21184 – Region of the 20 and 50 SMAs on Daily Price Chart. Both acted as support on Thursday 12th January.
- Price Target 1: 1.21442 – 50% Fib retracement price level.
- Price Target 2: 1.22 – Psychologically important round number price resistance.
- Stop Loss: < 1.18413 – Year-to-date intraday price low, recorded on 6th January 2023.
EURUSD
Following last week’s strong performance, EURUSD has started this week looking rather over-extended. The RSI of 65.2 points to the currency pair being overbought on a short-term basis, and price is some way above the 20 SMA on the Daily Price Chart.
EURUSD Chart – Daily Price Chart – Price Channel Break
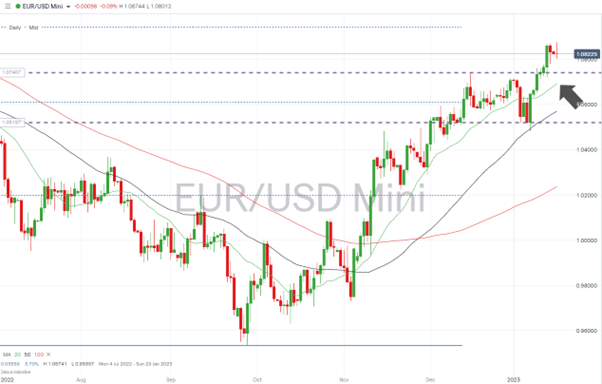
Source: IG
EURUSD Chart – Hourly Price Chart
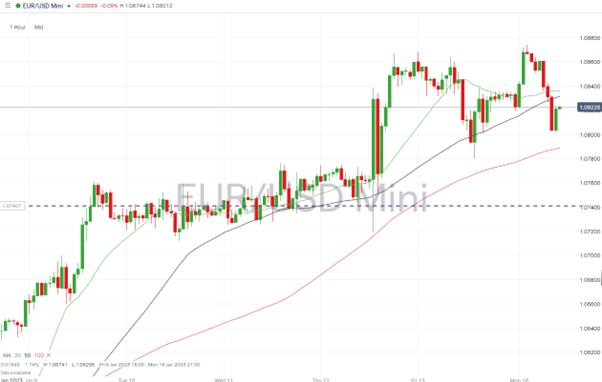
Source: IG
Short positions
- Entry Level 1: 1.08741 – Selling into strength which takes price to the region of the intraday price high of Monday 16th January.
- Price Target 1: 1.7364 – Upper trendline of sideways price channel formed in December and January. Intraday price high of 15th December 2022.
- Price Target 2: 1.04823 – Year-to-date price low of 6th January 2023.
- Stop Loss: > 1.09423 – Resistance offered by 50% Fib retracement of the price move of January 2021 to September 2022.
Long positions
- Entry Level 1: 1.07891 – Region of the 100 SMA on the Hourly Price Chart.
- Price Target 1: 1.08316 – Region of 20 and 50 SMA converging on the Daily Price Chart.
- Price Target 2: 1.08741 – Intraday price high of Monday 16th January
- Stop Loss: <1.7364 – Trendline of price channel formed in December and January.
Indices
S&P 500
Last week’s US CPI inflation number came in at a level most analysts had expected. Stock traders took the absence of any surprises as another buy signal, and the S&P 500 index is currently showing a 3.52% year-to-date gain.
With price in close proximity to the hugely important downward trendline dating to January 2022, there is every chance of a short-term pullback as traders take profits and reassess the prospects of US stocks.
S&P 500 Chart – Daily Price Chart – Approaching Trendline Resistance
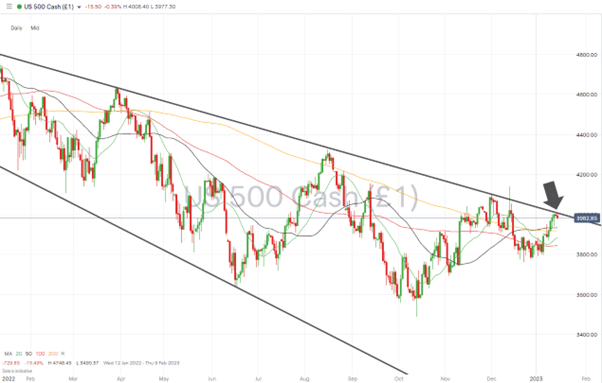
Source: IG
S&P 500 – Hourly Price Chart
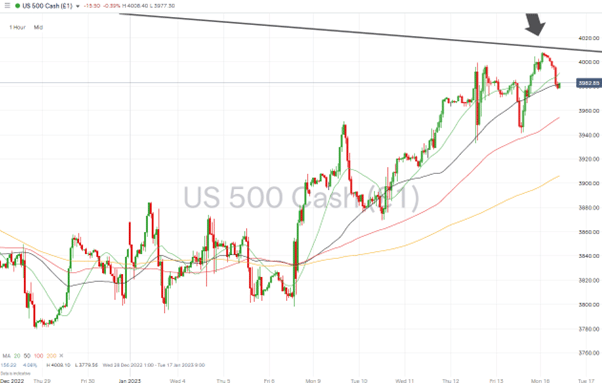
Source: IG
Short positions
- Entry Level 1: 4,010 – Region of the downward trendline which has acted as resistance since January 2022.
- Price Target 1: 3,954 – Region of the 100 SMA on the Hourly Price Chart.
- Price Target 2: 3,891 – This level is in the region of the 20 SMA on the Daily Price Chart, and price reaching this level would represent a break of the supporting trendline dating from Friday 6th January.
- Stop Loss: > 4,050 – Above the trendline of the multi-month downward price channel.
Long positions
- Entry Level 1: 4,010 – Applying a momentum-based strategy to trade a break out above the resistance offered by the long-term trendline.
- Price Target 1: 4,140 – Price high of Tuesday 13th December 2022.
- Stop Loss: < 3,891 – Region of the 20 SMA on the Daily Price Chart.
Crypto – Bitcoin & Ethereum
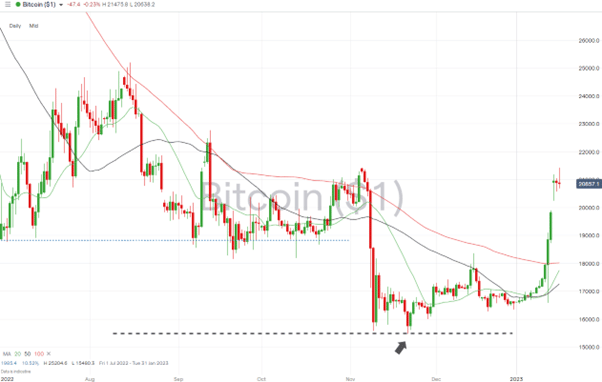
With a vast number of forced sellers now out of the market, Bitcoin and Ethereum have posted significant gains. The week-on-week increases in value being 24.63% for BTC and 28.75% for ETH.
Bitcoin Price Chart – Daily Price Chart – Breakout
Source: IG
Bitcoin Long positions
- Entry Level 1: 21,424 – Buying into further price gains and taking a break of the price high of 5th November 2022 as a sign that upward momentum remains strong.
- Price Target 1: 22,778 – Price high of 13th September 2022.
- Price Target 1: 25,204 – Yearly high of 2022 recorded on 15th August 2022.
- Stop Losses: < 20,000 – Psychologically significant ‘round number’ support level.
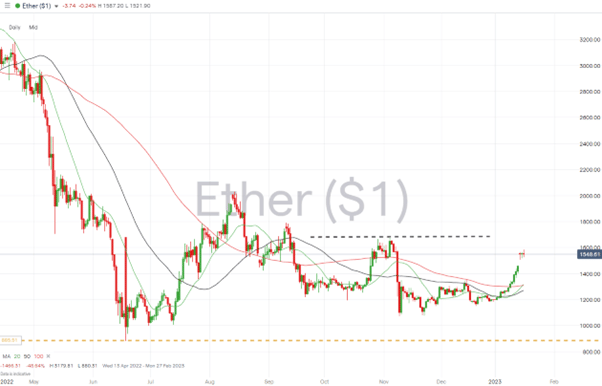
Ethereum
Ethereum Chart – Daily Price Chart – Breakout
Source: IG
Ethereum Long positions
- Entry Level 1: 1,676 – Buying into further price gains and applying a breakout style strategy in the region of the price high of 4th November 2022.
- Price Target 1: 2,012 – Price high of 13th August 2022 and just above the 20k price barrier.
- Stop Losses: < 1,307 – Region of the 20 and 50 SMA’s on the Daily Price Chart.
Risk Statement: Trading financial products carries a high risk to your capital, especially trading leverage products such as CFDs. They may not be suitable for everyone. Please make sure that you fully understand the risks. You should consider whether you can afford to take the risk of losing your money.

Forextraders' Broker of the Month
BlackBull Markets is a reliable and well-respected trading platform that provides its customers with high-quality access to a wide range of asset groups. The broker is headquartered in New Zealand which explains why it has flown under the radar for a few years but it is a great broker that is now building a global following. The BlackBull Markets site is intuitive and easy to use, making it an ideal choice for beginners.