
FOCUS ON: Huge Week in Terms of News Releases Leaves Markets Primed for a Big Move
- Huge week in terms of economic data
- Divergence in sentiment between equity and forex assets
- Stocks showing strength and forex pairs trading sideways
Trading Ideas
We created this Weekly Tips section to share possible trade entry and exit points based on our technical analysis. We also have other methods to validate our trades which we can’t publicly share that help to increase their success. All our trades include entry and at least one target price. Stop losses are applied at the reader’s discretion. Our strategies typically trade with a wide stop loss, and risk is further mitigated by trading in small sizes.
Our trading signal analysis is based on a comprehensive summary of market data. We use a range of metrics with weighting given to simple and exponential moving averages and key technical indicators.
Instrument | Price | Hourly | Daily |
GBP/USD | 1.2372 | Strong Buy | Strong Buy |
EUR/USD | 1.0881 | Strong Buy | Strong Buy |
USD/JPY | 130.12 | Buy | Sell |
S&P 500 | 4,038 | Strong Buy | Strong Buy |
NASDAQ 100 | 12,046 | Strong Buy | Strong Buy |
FTSE100 | 7,753 | Neutral | Neutral |
Gold | 1,922 | Strong Buy | Strong Buy |
Crude Oil WTI | 79.03 | Sell | Strong Sell |
Bitcoin | 23,499 | Buy | Strong Buy |
Ethereum | 1,616 | Strong Buy | Strong Buy |
UTC: 9:59
US Dollar Basket Index (DXY)
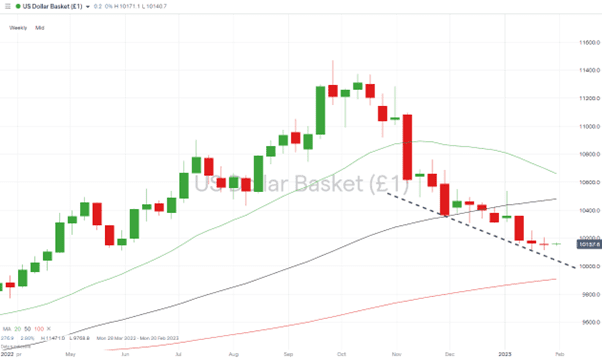
The US Dollar Basket index formed a relatively narrow sideways trading pattern last week, but with a bumper amount of economic data due to be released in the coming days a break of that channel can be expected.
Whether price heads upward or downward will depend on the US Federal Reserve’s decision regarding interest rates (Wednesday 1st February), and the US Non-Farm Payroll jobs numbers which are released on Friday 3rd February. But with macroeconomic events coming into the markets with full force a range of technical trade entry points could be triggered.
US Dollar Basket Chart – Weekly Price Chart – Downwards Trend
Source: IG
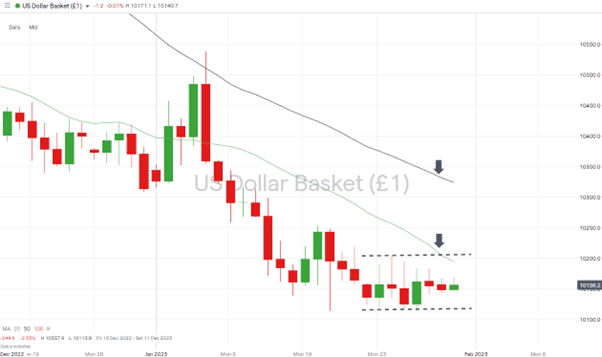
US Dollar Basket Chart – Daily Price Chart
Source: IG
Short positions
- Entry Level 1: 101.94 – Region of the 20 SMA on the Daily Price Chart. Price hasn’t closed above that metric since Thursday 5th January 2023.
- Price Target 1: 101.14 – Year-to-date price low recorded on 26th January 2023. This price level was also tested on 18th, 23rd and 25th January and marks an area of significant price support.
- Price Target 2: 100.24 – In extension, region of the supporting trendline on the Weekly Price Chart.
- Stop Loss: > 102.04 – Region of the upper trendline of the sideways trading pattern formed between 23rd – 30th January 2023.
Long positions
- Entry Level 1: 101.14 – Year-to-date price low recorded on 26th January 2023 and tested on 18th, 23rd and 25th January. With the RSI on the Daily Price Chart trading at 38.08 the index is far from being ‘overbought’ on that timeframe.
- Price Target 1: 102.04 – Region of the upper trendline of the sideways trading pattern formed between 23rd – 30th January.
- Price Target 2: 103.00 – Psychologically important price level and region of the 50 SMA on the Daily Price Chart.
- Stop Loss: < 100.24 – Region of the supporting trendline on the Weekly Price Chart and close to parity price level.
GBPUSD
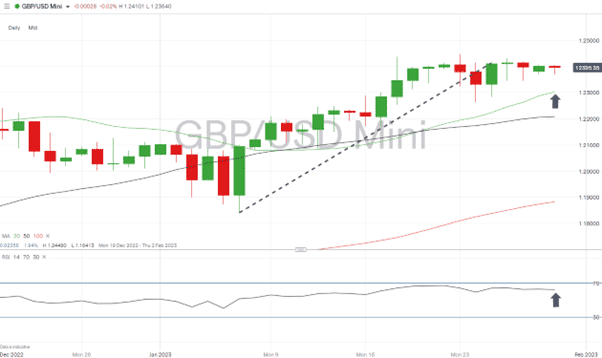
Cable’s week-on-week price change of -0.25% reflects the GBPUSD currency pair’s reluctance to break in either direction prior to the Bank of England’s interest rate decision due on Thursday 2nd February.
Further sideways trading can be expected in the run-up to that crucial news release, but the US Fed’s interest rate decision released the day before will also play a part in determining which way price will head next.
Daily Price Chart – GBPUSD Chart – Daily Price Chart
Source: IG
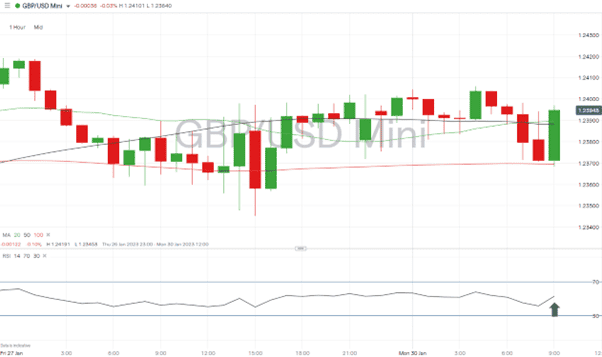
GBPUSD Chart – Hourly Price Chart
Source: IG
Short positions
- Entry Level 1: 1.24480 – YTD price high recorded on 23rd January 2022. Also in the region of 1.24470 printed on 14th December and which previously marked the 6-month closing high at that time.
- Price Target 1: 1.2304 – Region of the 20 SMA on the Daily Price Chart.
- Price Target 2: 1.22156 – The 61.8% Fibonacci retracement price level formed by the price fall between 14th December 2022 and 6th January 2023.
- Stop Loss: > 1.2500 – Round number price level.
Long positions
- Entry Level 1: 1.22632 – The week-long price consolidation by GBPUSD has increased the potential for another bounce. On the Daily Price Chart, the RSI has dropped away from being close to being overbought, and the divergence between the 20 SMA and price reported here, has narrowed.
- Price Target 1: 1.24480 – YTD price high recorded on 23rd January 2022.
- Stop Loss: < 1.23041 – 76.4% Fib retracement of the December 2022 to January 2023 price fall. In the region of the ‘round number’ resistance which can be expected near the 1.2300 price level.
EURUSD
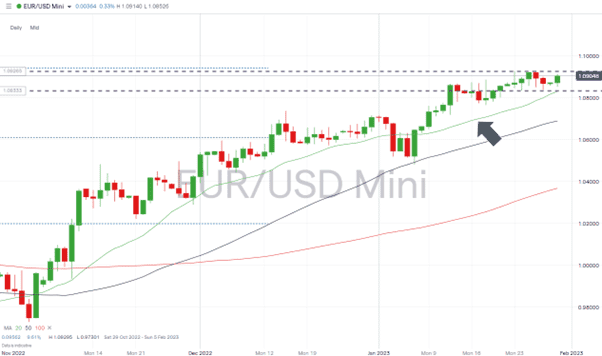
While EURUSD fell by 0.19% over the week the euro continues to outperform compared to the British pound. The sideways trading has allowed the longer-term SMAs to catch up with price after the rises earlier in the year and another move to the upside can’t be discounted.
Much will depend on the news from the ECB which updates the markets regarding Eurozone interest rates on Thursday 2nd February.
EURUSD Chart – Daily Price Chart – Sideways Trading Pattern
Source: IG
EURUSD Chart – Hourly Price Chart
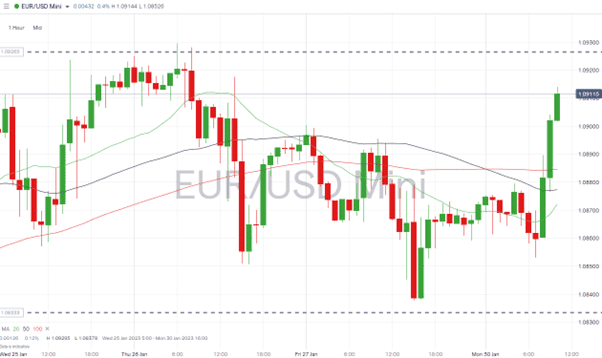
Source: IG
Short positions
- Entry Level 1: 1.09423 – 50% Fibonacci retracement of the downward price move of January 2021 to September 2022. Long-term resistance price level.
- Price Target 1: 1.08306 – Region of the 20 SMA on the Daily Price Chart. Acted as price support on 24th and 27th January.
- Stop Loss: > 1.1000 – Psychologically important resistance level.
Long positions
- Entry Level 1: 1.08306 – Buying into weakness which takes price to the region of the 20 SMA on the Daily Price Chart and the bottom end of the sideways trading pattern of last week.
- Price Target 1: 1.0995 – Weekly price high of Monday 26th January.
- Price Target 2: 1.1000 – Round number price level.
- Stop Loss: <1.07662 – Swing-low price level recorded intraday on 18th January 2023.
Indices
S&P 500
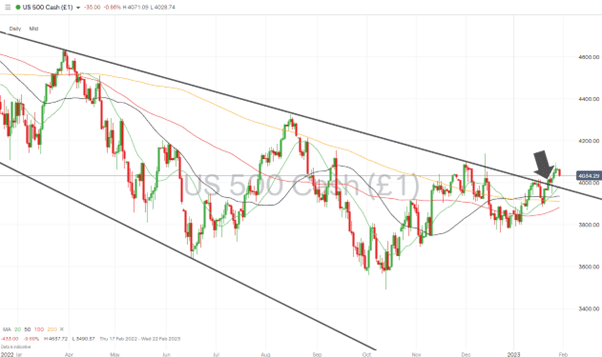
The rally in equities was the major news event of last week. Despite earnings reports of big corporations being mixed, investor sentiment remained bullish with many considering stocks to be undervalued at current levels.
Equity markets are known for rallying before an economy turns around, and that ability for them to be a leading indicator is attracting buyers at current levels.
S&P 500 Chart – Daily Price Chart – Break of Long-Term Trendline
Source: IG
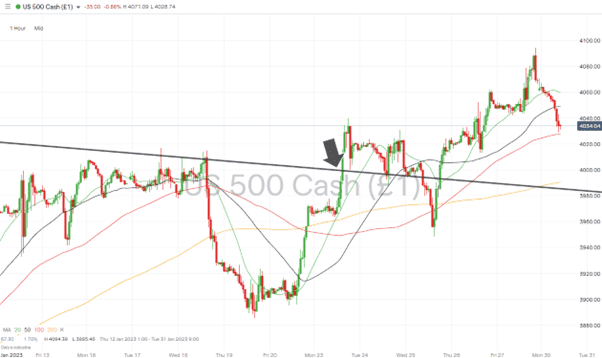
S&P 500 – Hourly Price Chart
Source: IG
Short positions
- Entry Level 1: 3,985 – Selling short into a bullish stock market is a risky proposition. A return to below the downward trendline which dates from January 2022 would need to be confirmed before entering into short positions.
- Price Target 1: 3,885 – Price level recorded on 19th January, and which forms a swing-low price pattern. Also, the region of the 100 SMA on the Daily Price Chart (3882).
- Stop Loss: > 4,040 – Above the trendline of the multi-month downward price channel and psychologically important 4k price level.
Long positions
- Entry Level 1: 3,982 – Applying a momentum-based strategy to buy into further upward price moves. Region of the long-term downward trendline, and the 20 SMA on the Daily Price Chart.
- Price Target 1: 4,094 – Intraday price high of Friday 27th January.
- Stop Loss: < 3,935 – Region of the 50 SMA on the Daily Price Chart.
Crypto – Bitcoin & Ethereum
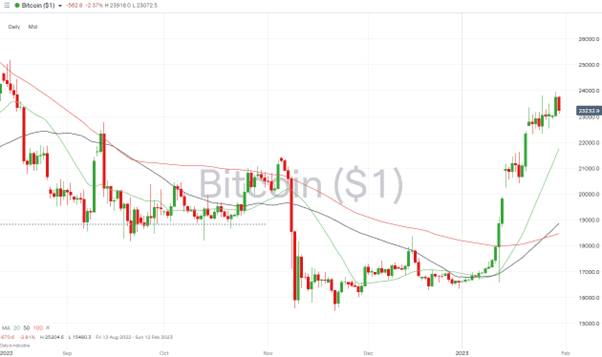
After a strong start to the year, the price of both Bitcoin and Ethereum have entered into consolidation patterns. This still leaves room for fans of the coins to buy into periodic weakness.
Bitcoin Price Chart – Daily Price Chart – Consolidation
Source: IG
Bitcoin Long positions
- Entry Level 1: 22,334 – Buying into any short-term price weakness using the price low of 25th January as an entry point.
- Price Target 1: 23,956 – Price high of 29th January and region of the 24k ‘round number’ price level.
- Price Target 2: 25,204 – Yearly high of 2022, recorded on 15th August.
- Stop Losses: < 20,000 – Psychologically important ‘round number’ support level.
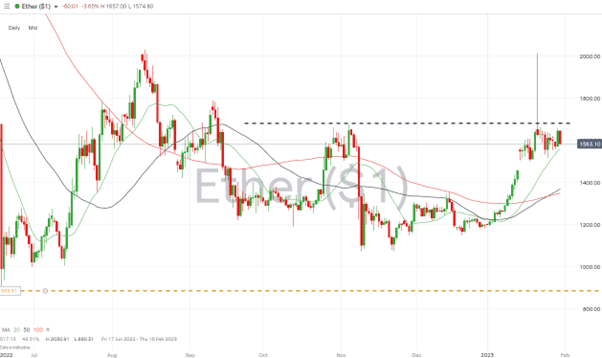
Ethereum
Ethereum Chart – Daily Price Chart
Source: IG
Ethereum Long positions
- Entry Level 1: 1,562 – Buying into further weakness which takes price into the region of the 20 SMA on the Daily Price Chart.
- Price Target 1: 2,000 – Round number price level. Also, the region of the price high of 13th August 2022.
- Stop Losses: < 1,462 – Closing price of Friday 13th January. Could be tested by a gap-fill price move.
Risk Statement: Trading financial products carries a high risk to your capital, especially trading leverage products such as CFDs. They may not be suitable for everyone. Please make sure that you fully understand the risks. You should consider whether you can afford to take the risk of losing your money.

Forextraders' Broker of the Month
BlackBull Markets is a reliable and well-respected trading platform that provides its customers with high-quality access to a wide range of asset groups. The broker is headquartered in New Zealand which explains why it has flown under the radar for a few years but it is a great broker that is now building a global following. The BlackBull Markets site is intuitive and easy to use, making it an ideal choice for beginners.