
FOCUS ON: Continuation of Risk-on Trend Takes Prices Within Touching Distance of Key Resistance Levels
- Further gains for EURUSD and GBPUSD
- Major markets approaching critical price levels
- Crypto rally reflects change in market sentiment
Trading Ideas
We created this Weekly Tips section to share possible trade entry and exit points based on our technical analysis. We also have other methods to validate our trades which we can’t publicly share that help to increase their success. All our trades include entry and at least one target price. Stop losses are applied at the reader’s discretion. Our strategies typically trade with a wide stop loss, and risk is further mitigated by trading in small sizes.
Instrument | Price | Hourly | Daily |
EUR/USD | 1.0902 | Neutral | Strong Buy |
GBP/USD | 1.2403 | Strong Buy | Strong Buy |
USD/JPY | 130.11 | Strong Buy | Strong Sell |
S&P 500 | 3,968 | Strong Buy | Strong Buy |
NASDAQ 100 | 11,609 | Strong Buy | Strong Buy |
FTSE100 | 7,773 | Neutral | Strong Buy |
Gold | 1,920 | Strong Sell | Strong Buy |
Crude Oil WTI | 81.47 | Strong Buy | Strong Buy |
Bitcoin | 22,655 | Strong Buy | Strong Buy |
Ethereum | 1,631 | Strong Buy | Strong Buy |
UTC: 9:42
US Dollar Basket Index (DXY)
The rally in the US Dollar index (DXY), which marked the beginning of the week of 16th January, was followed by three down days and another negative week for the dollar. Only three of the last 11 weeks have seen a gain in the greenback’s value, and even those upward moves were small.
With bearish sentiment dominating the market, many have been looking for ways to put on short dollar positions. The pullback on Wednesday 18th January was one opportunity. Other short-term rallies, which take price towards the 20 and 50 SMAs on the Daily Price Chart, continue to look like opportunities to follow the downward trend.
US Dollar Basket Chart – Weekly Price Chart – Downwards Trend
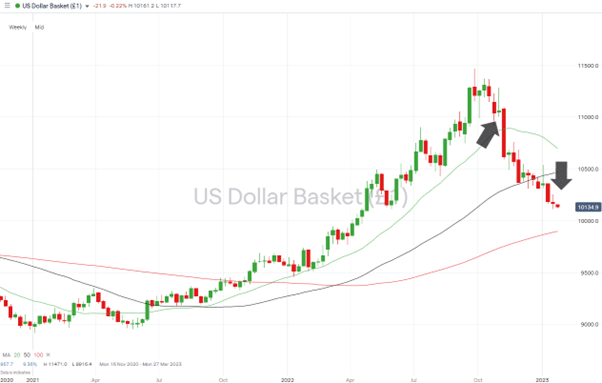
Source: IG
US Dollar Basket Chart – Daily Price Chart
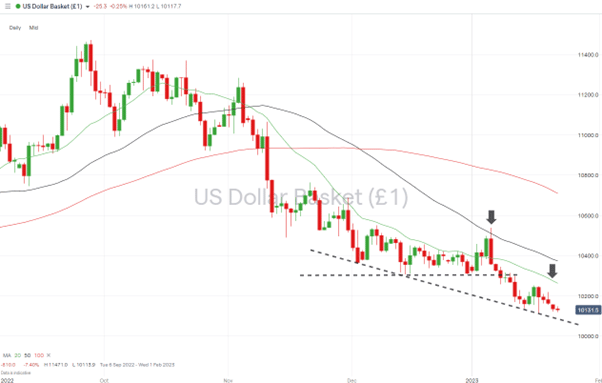
Source: IG
The supporting trendline dating from 2nd December 2022 currently sits in the region of 100.83. A move to that region of the chart opens the door for a test of the psychologically important 100.00 price level.
Any suggestion that US inflation and interest rates will remain higher than expected would result in a rally in DXY, but with price levels being what they are, there is every chance of at least a test of 100.00.
Short positions
- Entry Level 1: 102.63 – Selling into strength takes price to the region of the 20 SMA on the Daily Price Chart.
- Price Target 1: 101.13 – Year-to-date price low recorded on 18th January 2023.
- Price Target 2: 100.83 – Region of the supporting trendline on the Daily Price Chart.
- Stop Loss: > 103.74 – Region of the 50 SMA on the Daily Price Chart. Price has not closed above this metric since 3rd November 2022.
Long positions
- Entry Level 1: 101.13 – YTD Price low of 18th January. The RSI on the Daily Price Chart is currently at 33.21. That’s a fall from last week’s reading of 36.5, but while low RSI hasn’t yet crossed over to print below 30 and trigger buying activity from traders looking for signs of the dollar being oversold.
- Price Target 1: 102.75 – Region of the 50 SMA on the Daily Price Chart.
- Price Target 2: 105.37 – Year-to-date price high recorded on Friday 6th January.
- Stop Loss: < 100.83 – Region of the supporting trendline dating from 2nd December 2022.
GBPUSD
Cable ended last week by posting four consecutive up days. That has taken the RSI on the Daily Price Chart to 67.9, which indicates the currency pair is nearing ‘overbought’ territory. The rally has also led to a divergence between price and the 20 SMA on the Daily Price Chart.
Both indicators open the door to the possibility of a short-term pullback in the bull run dating back to 6th January; however, without a break of the supporting trendline, profits on short GBPUSD trades look likely to be capped in the region of 1.235.
GBPUSD Chart – Daily Price Chart
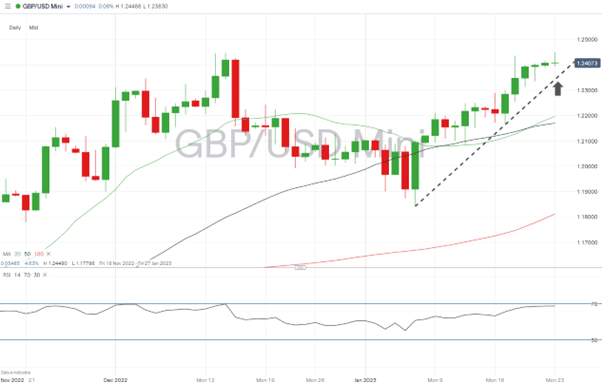
Source: IG
GBPUSD Chart – Hourly Price Chart
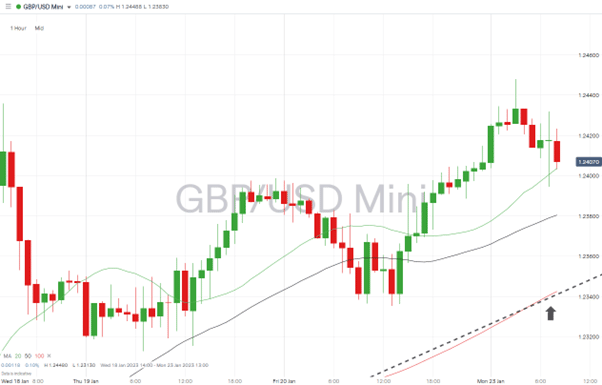
Source: IG
Short positions
- Entry Level 1: 1.24815 – Selling into strength which takes price to the 6-month closing high of Wednesday 14th December 2022.
- Price Target 1: 1.2350 – Region of the supporting trendline on the Daily Price Chart.
- Price Target 2: 1.22156 – The 61.8% Fibonacci retracement price level formed by the price fall between 14th December 2022 and 6th January 2023.
- Stop Loss: > 1.24480 – Year-to-date price high recorded on 23rd January 2022. Also, the region of the price high of 1.24470 printed on 14th December 2022.
Long positions
- Entry Level 1: 1.23041 – 76.4% Fib retracement of the December to January price fall. Also, just above the ’round number’ resistance which can be expected near the 1.23 price level.
- Price Target 1: 1.24480 – YTD price high recorded on 23rd January 2022.
- Stop Loss: < 1.2200 – Psychologically important ’round number’ price level and region of the 20 SMA on the Daily Price Chart.
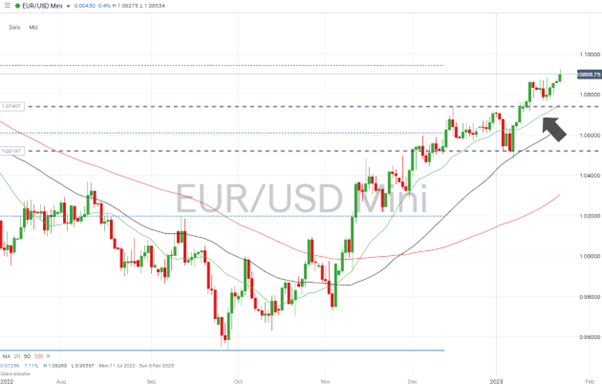
EURUSD
The euro’s outperformance of the British pound continues. GBPUSD has started the trading week trading below year-to-date highs, while EURUSD price charts show price continuing to climb to new levels.
Significant price support can be found in the region of 107.364. That marks the price high of 15th December 2022 and the top of the sideways price channel that EURUSD traded in during the turn of the year.
EURUSD Chart – Daily Price Chart – New Highs
Source: IG
EURUSD Chart – Hourly Price Chart
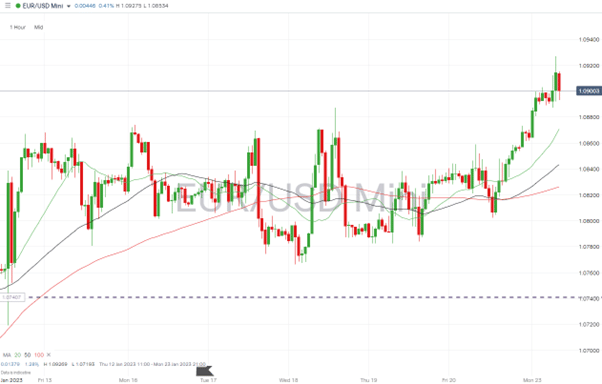
Source: IG
Short positions
- Entry Level 1: 1.09423 – Resistance level formed by the 50% Fibonacci retracement of the price move of January 2021 to September 2022.
- Price Target 1: 1.07364 – Upper range of sideways price channel formed between 8th December 2022 and 10th January 2023. Also, the intraday price high of 15th December 2022 and region of the 20 SMA on the Daily Price Chart (currently 1.07496).
- Stop Loss: > 1.1000 – Round number price resistance level.
Long positions
- Entry Level 1: 1.07662 – Region of the 20 SMA on the Daily Price Chart and swing-low price level recorded intraday on 18th January 2023.
- Price Target 1: 1.09269 – Intraday price high of Monday 23rd January.
- Price Target 2: 1.09423 – Resistance level formed by the 50% Fib retracement.
- Price Target 3: 1.1000 – Psychologically important price level.
- Stop Loss: <1.7364 – Upper trendline of December-January sideways price channel.
Indices
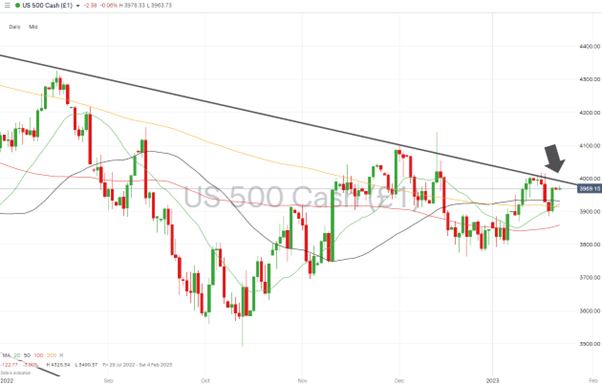
S&P 500
Risk-on appetite returned to the US stock market on Friday, with the S&P 500 index posting a 1.79% up day. Significant resistance sits in the region of 3990, which marks the area of the downward trendline dating back to January 2022.
Just above that is the psychologically important 4,000 price level, which means any breakout to above those levels would mark a significant shift in investor sentiment. That opens up the possibility of a near-term pullback as traders take profits on long positions or there is more aggressive shorting.
S&P 500 Chart – Daily Price Chart – Approaching trendline resistance, again.
Source: IG
S&P 500 – Hourly Price Chart
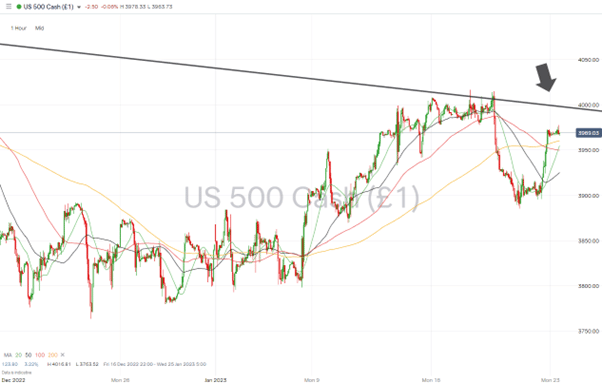
Source: IG
Short positions
- Entry Level 1: 3,990 – Region of the downward trendline, which has acted as resistance since January 2022.
- Price Target 1: 3,930 – Region of the 50 SMA on the Hourly Price Chart and just above the 20 SMA (3922).
- Price Target 2: 3,885 – Price level recorded on 19th January, which forms a swing-low price pattern.
- Stop Loss: > 4,050 – Above the trendline of the multi-month downward price channel and psychologically important 4k price level.
Long positions
- Entry Level 1: 4,010 – With price currently trading just below two key resistance levels, the best option for bullish traders is to wait and see if an upward move is confirmed. A close above 4,010 would create a situation where a momentum-based strategy could be applied.
- Price Target 1: 4,140 – Intraday price high of Tuesday 13th December 2022.
- Stop Loss: < 3,922 – Region of the 20 SMA on the Daily Price Chart and below the 4,000-price level.
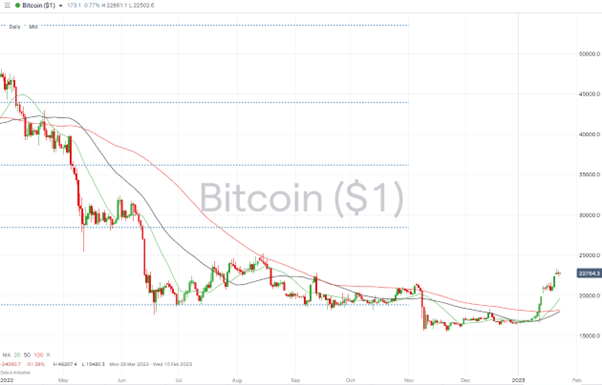
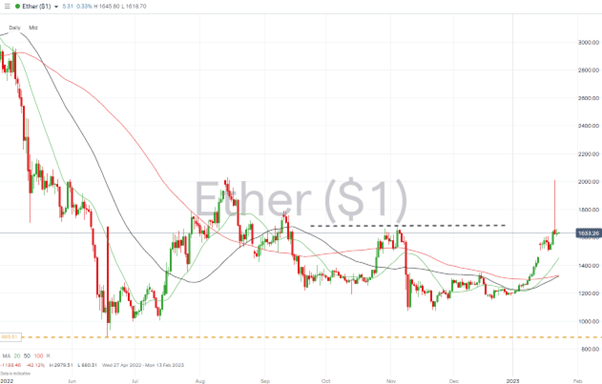
Crypto – Bitcoin & Ethereum
A second up-week in a row means Bitcoin and Ethereum are respectively up 37.55% and 36.94% on the year. The considerable momentum behind the moves has taken price through key long-term resistance levels and could cause an influx of new buyers.
Bitcoin Price Chart – Daily Price Chart – Breakout Confirmed
Source: IG
Bitcoin Long positions
- Entry Level 1: 21,424 – Buying into any short-term price weakness using the price high of 5th November 2022 as an entry point. This acted as resistance between the 14th and 19th of January and can now be expected to offer support.
- Price Target 1: 22,778 – Price high of 13th September 2022.
- Price Target 2: 25,204 – Yearly high of 2022 recorded on 15th August.
- Stop Losses: < 20,000 – Psychologically important ’round number’ support level.
Ethereum
Ethereum Chart – Daily Price Chart – Upwards Momentum
Source: IG
Ethereum Long positions
- Entry Level 1: 1,676 – Buying into further price gains and applying a breakout strategy once price trades above the price high of 4th November 2022.
- Price Target 1: 2,000 – Round number price level.
- Price Target 2: 2,012 – Price high of 13th August 2022 and just above the 20k price barrier.
- Stop Losses: < 1,453 – Region of the 20 SMA on the Daily Price Chart.
Risk Statement: Trading financial products carries a high risk to your capital, especially trading leverage products such as CFDs. They may not be suitable for everyone. Please make sure that you fully understand the risks. You should consider whether you can afford to take the risk of losing your money.

Forextraders' Broker of the Month
BlackBull Markets is a reliable and well-respected trading platform that provides its customers with high-quality access to a wide range of asset groups. The broker is headquartered in New Zealand which explains why it has flown under the radar for a few years but it is a great broker that is now building a global following. The BlackBull Markets site is intuitive and easy to use, making it an ideal choice for beginners.