
- Further signs that US inflation is cooling have led to more US dollar weakness
- US PPI comes in at -0.5% rather than -0.1%
- SMA and Fib metrics set to guide price lower
Traders who had positioned themselves in risk-on assets welcomed the US PPI inflation report released on Wednesday that showed wholesale price rises in December were lower than expected. With the index oversold on a short-term timeframe, a retracement soon followed, but the US Dollar index still posted a down day.
Jerome Powell and his US Federal Reserve colleagues aren’t due to adjust interest rates until their next FOMC meeting in February. That raises the question of whether this could be the time to short the dollar.
US Inflation Rate Cools
US wholesale price inflation in December was weaker than expected. The Producer Price Index, which measures final demand among hundreds of categories of wholesale items, declined by 0.5% in December, compared to analyst forecasts of a 0.1% reduction.
That’s a big miss for a key measure of the most important economy in the world and offers support to those who think inflation has been beaten.
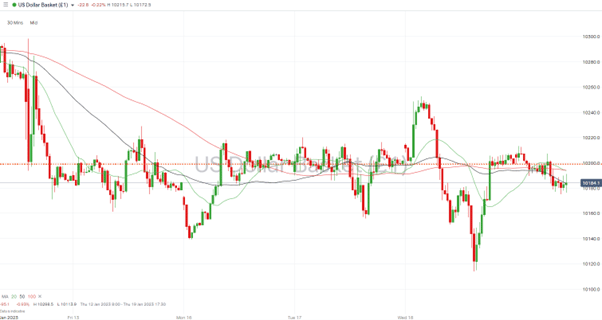
Further hope for fans of stocks, sterling, and the euro was offered by November’s PPI increase of 0.3% being adjusted downward to 0.2%. The fight against inflation may not have been won, but there was enough of a suggestion in both reports to trigger a run on the dollar. The US Dollar Basket index at one point on Wednesday showed an intraday loss of 1.26%.
US Dollar Basket index – 30 Minute Price Chart 19th Jan 2023
Source: IG
Also Read: What is the USD Index?
Some profit-taking can be expected, and the price support in the region of 102.20 will undoubtedly encourage some to crystalise gains on short dollar positions. However, price action on the Daily Price Chart can only be described as bearish.
Entry Levels for Short US Dollar Basket Trades
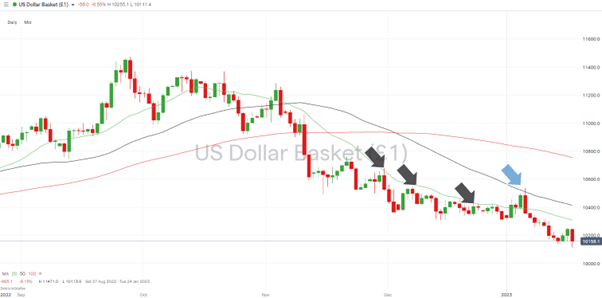
Two indicators, which have so far been effective guides of the downward move in the dollar, have been the 20 and 50 SMAs on the Daily Price Chart. The former has acted as resistance to upward price moves on several occasions since October 2022. The 50 SMA gave price a decisive downward nudge on Friday 6th January 2023.
US Dollar Basket index – Daily Price Chart 2022 – 2023 – SMAs
Source: IG
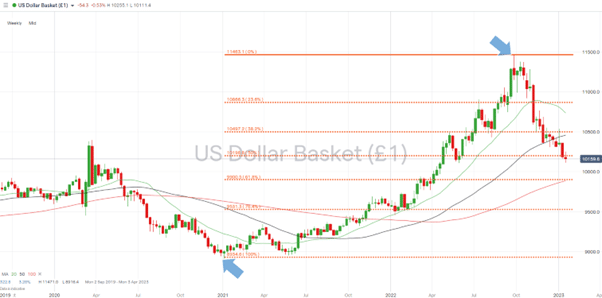
The other metric to consider is the 50% Fibonacci Retracement price level relating to the USD rally that started in January 2021 and peaked in September 2022. That sits at 101.98, and after providing support in the past weeks, it now acts as resistance.
Wednesday evening’s rally in the dollar has taken price back into the region of the Fib retracement, and further strength can’t be discounted. But without a break of 101.98, the Fib price level is an opportunity for those looking to short the dollar who are unwilling to wait for price to rise to meet the SMAs.
US Dollar Basket index – Weekly Price Chart 2021 – 2022 – Fib Retracement
Source: IG
Regarding trade exit points, the 61.8% Fib level of 99.00 currently sits in the region of the 100 SMA on the Weekly Price Chart. Both metrics are just below the hugely important psychological price level of 100.00, which looks like an appropriate target price for short US Dollar Basket index trades.
People Also Read
- US Inflation Cools in December
- Risk Appetite Returns, But Not to All Markets
- The Week Ahead – 16th January 2023
If you have been the victim of a scam, suspect fraudulent behaviour, or want to know more about this topic, please contact us at [email protected]
 Your capital is at risk
  Your capital is at risk