FOCUS ON: US & UK Inflation Reports
- UK and US CPI inflation data due to be released
- With price rises still guiding interest rate policy Tuesday’s and Wednesday’s numbers are keenly awaited
- Comes on the back of a week of whip-sawing prices
Trading Ideas
We created this Weekly Tips section to share possible trade entry and exit points based on our technical analysis. We also have other methods to validate our trades which we can’t publicly share that help to increase their success. All our trades include entry and at least one target price. Stop losses are applied at the reader’s discretion. Our strategies typically trade with a wide stop loss, and risk is further mitigated by trading in small sizes.
Instrument | Price | Hourly | Daily |
GBP/USD | 1.2055 | Neutral | Strong Sell |
EUR/USD | 1.0681 | Neutral | Strong Sell |
USD/JPY | 132.37 | Strong Buy | Strong Buy |
S&P 500 | 4,086 | Neutral | Strong Buy |
NASDAQ 100 | 12,302 | Sell | Buy |
FTSE100 | 7,902 | Buy | Strong Buy |
Gold | 1,862 | Neutral | Neutral |
Crude Oil WTI | 79.06 | Neutral | Strong Buy |
Bitcoin | 21,716 | Strong Sell | Sell |
Ethereum | 1,506 | Strong Sell | Strong Sell |
UTC: 09:56
US Dollar Basket Index (DXY)
Last week’s move by the US Dollar Basket index through the 50 SMA on the Daily Price Chart may have been unspectacular, but it is undoubtedly significant. The close above that key metric on Monday 6th Feb is potentially game-changing due to the last bullish close being recorded on 3rd November 2022.
Daily price charts show price continuing to close above the 50 SMA, but the consolidatory price action leaves room for fans of the greenback to enter long positions.
With the RSI on the Daily Price Chart at 59.12, there is room for price to move significantly in either direction before becoming ‘overbought’ or ‘oversold’ on that timeframe.
US Dollar Basket Chart – Daily Price Chart – Above 50 SMA
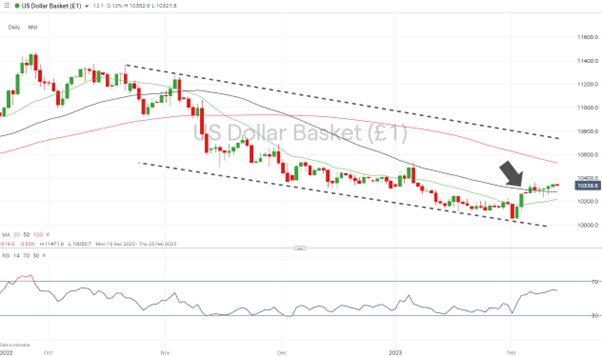
Source: IG
US Dollar Basket Chart – Hourly Price Chart
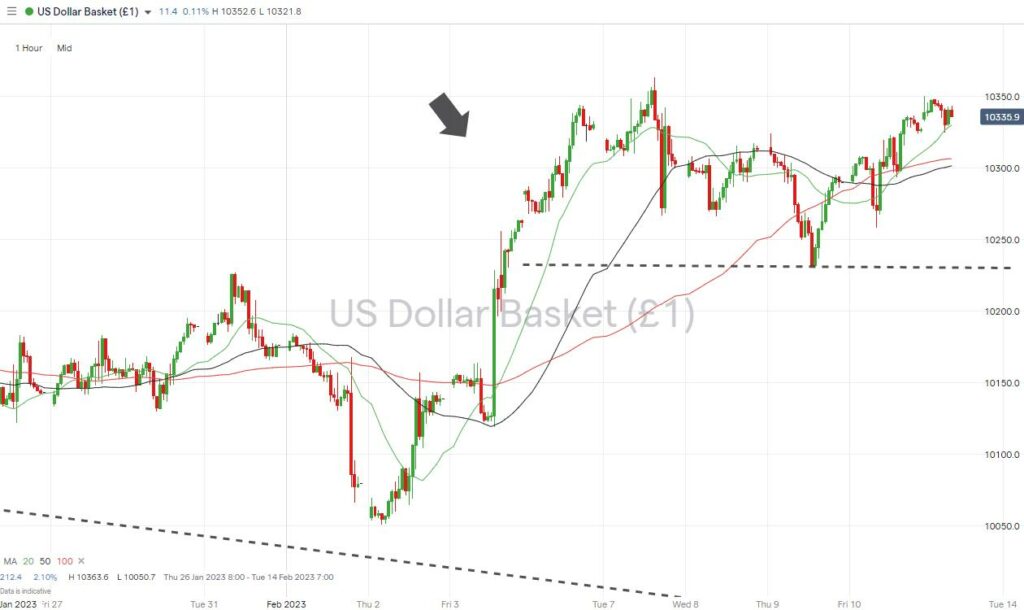
Source: IG
Short positions
- Entry Level 1: 102.82 – Region of the 50 SMA on the Daily Price Chart. Applying a momentum-based strategy anticipating renewed dollar weakness.
- Price Target 1: 101.95 – Price low of week beginning 6th February 2023, recorded on 9th February. Also, the region of the 20 SMA on the Daily Price Chart.
- Price Target 2: 100.00 – Parity price level and region of supporting trendline of downward price channel.
- Stop Loss: > 105.37 – Year-to-date price high printed on 6th January and region of 100 SMA on the Daily Price Chart.
Long positions
- Entry Level 1: 102.82 – Buying into short-term weakness which takes price back to the support offered by the 50 SMA on the Daily Price Chart.
- Price Target 1: 103.64 – Price high of week beginning 6th February 2023, recorded on 7th February.
- Price Target 2: 105.37 – In extension, the year-to-date price high recorded on 6th January 2023 and the region of the 100 SMA on the Daily Price Chart.
- Stop Loss: < 102.18 – Region of the 100 SMA on the Daily Price Chart.
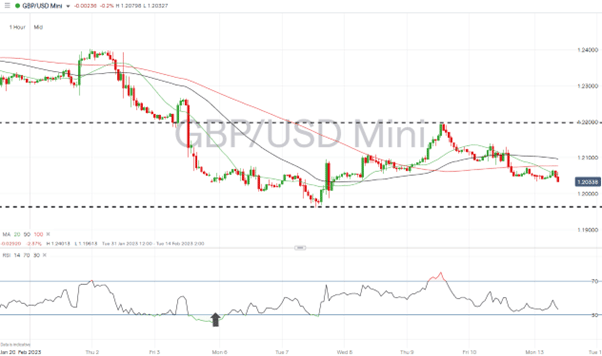
GBPUSD
Sterling’s potential double-top price pattern remains a possibility. Still, there is yet to be a break of the 1.18413 price level recorded on 6th January, which would open the door to continued downward price movement.
Over the last week, the RSI on the Daily Price Chart has moved to 37.09 from 35.82, which leaves more room for bearish price action. Short-sellers will be looking for the UK Inflation report to be released on Wednesday 15th February to act as a catalyst for GBPUSD price falls.
GBPUSD Chart – Daily Price Chart
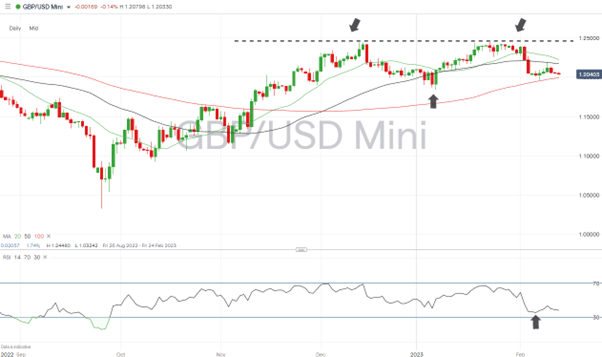
Source: IG
GBPUSD Chart – Hourly Price Chart
Source: IG
Short positions
- Entry Level 1: 1.21927 – Weekly price high recorded on 9th February 2023. Represents top of the sideways trading range seen during the week beginning 6th February.
- Price Target 1: 1.2000 – Psychologically important price level which can be expected to offer price support. Also, the region of the 100 SMA on the Daily Price Chart (1.19947).
- Price Target 2: 1.19613 – Weekly price low of 7th February.
- Stop Loss: > 1.22256 – Region of the 20 SMA on the Daily Price Chart.
Long positions
- Entry Level 1: 1.19948 – Region of the 100 SMA on the Daily Price Chart. Buying into weakness which takes towards the bottom end of last week’s sideways trading channel.
- Price Target 1: 1.21927 – Weekly price high recorded on 9th February 2023. Represents top of the sideways trading range seen during the week beginning 6th February.
- Price Target 2: 1.22156 – The 61.8% Fibonacci retracement price level formed by the price fall between 14th December 2022 and 6th January 2023.
- Stop Loss: < 1.18413 – Price low recorded on 6th January. Forms the bottom point of the potential double-top price pattern.
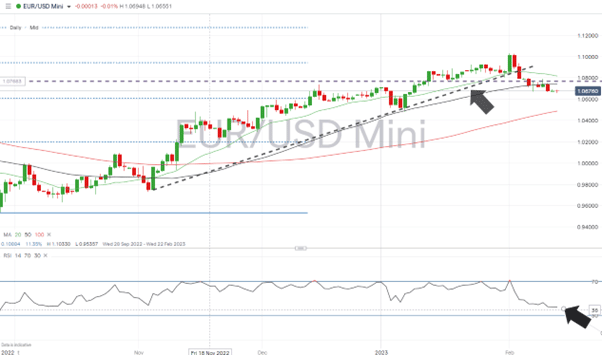
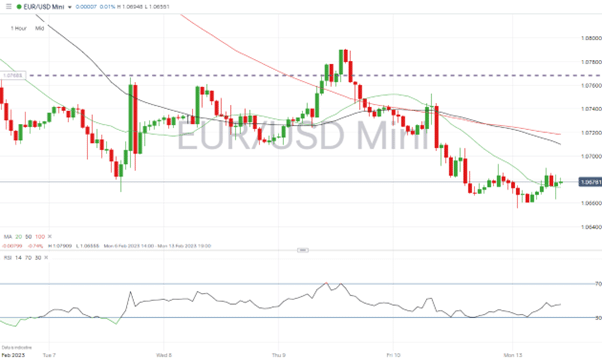
EURUSD
After several weeks of EURUSD outperforming GBPUSD, last week saw the euro fall in value against the dollar by a greater extent than the pound. The respective weekly falls of -0.95% and -0.04% could be more than a case of GBPUSD catching up. The EURUSD forex pair, in the process of its downward move, managed to crash through significant support levels, and the path of least resistance currently appears to be downward.
EURUSD Chart – Daily Price Chart – Trendline and SMA Break
Source: IG
EURUSD Chart – Hourly Price Chart
Source: IG
Short positions
- Entry Level 1: 1.07414 – Selling into short-term strength which takes price to the region of the 50 SMA on the Daily Price Chart.
- Price Target 1: 1.04822 – Price low of Wednesday 6th January. Year-to-date low and the region of the 100 SMA on the Daily Price Chart (104.883).
- Stop Loss: > 1.10330 – Price high of 1st February marks failed test of the psychologically important 1.10 resistance level.
Long positions
- Entry Level 1: 1.06692 – Short-term strategy for long positions in GBPUSD. Based on support offered by the 1.06692 price low recorded on 7th February 2023.
- Price Target 1: 1.07414 – Region of the 50 SMA on the Daily Price Chart.
- Price Target 2: 1.09423 – In extension, region of the 50% Fibonacci retracement of the downward price move seen between January 2021 and September 2022.
- Stop Loss: <1.05210 – Swing-low, year-to-date (closing) price level of 5th January 2023.
Indices
S&P 500
Earnings season is drawing to a close. Highlights of the coming week are Coca-Cola (Tuesday), Cisco (Wednesday), and Dropbox (Thursday). The US CPI inflation data due on Tuesday 14th February is the major economic report of the week.
The past week has seen US stocks trade within a wide price range. Extreme whip-sawing price action, demonstrated by the 2.20% intraday price surge on Tuesday 7th February, was followed by two days of price falls. They took the S&P 500 down towards the psychologically important 4,000 price level.
S&P 500 Chart – Daily Price Chart –Trendline Break Followed by Sideways Trading
Source: IG
S&P 500 – Hourly Price Chart
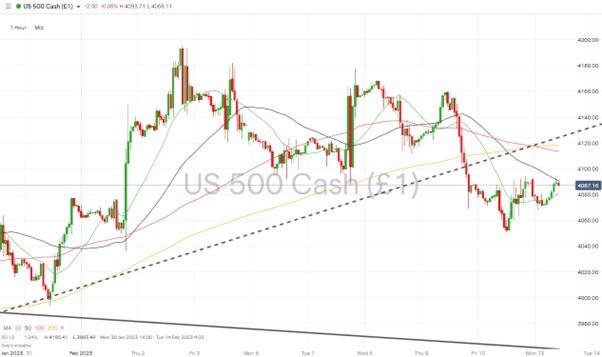
Source: IG
Short positions
- Entry Level 1: 4,078 – Selling into further price weakness, which causes a break of the support offered by the 20 SMA on the Daily Price Chart.
- Price Target 1: 3,964 – Region of the 50 SMA on the Daily Price Chart.
- Price Target 2: 3,941 – Upper trendline of the downward price channel dating from January 2022. Also, the region of the 200 SMA on the Daily Price Chart.
- Stop Loss: > 4,177 – Year-to-date high closing price recorded on 7th February 2023.
Long positions
- Entry Level 1: 4,078 – The 20 SMA on the Daily Price Chart is a key metric and also offers trade entry points for those looking to go long stocks.
- Price Target 1: 4,195 – Intraday price high of 2nd February 2023.
- Stop Loss: < 4,063 – Intra-week price low recorded on 10th February.
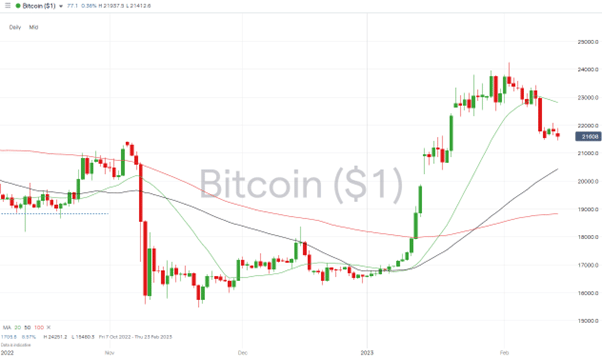
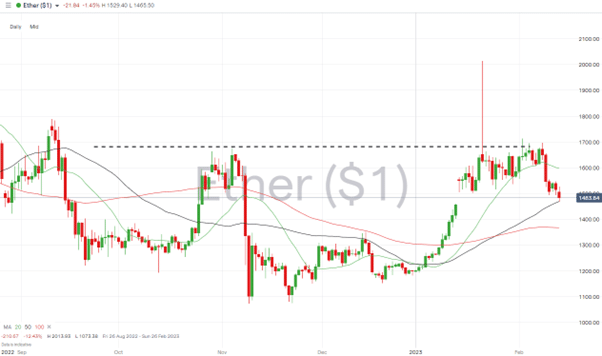
Crypto – Bitcoin & Ethereum
After a solid start to 2023, and a period of price consolidation, both big cryptos have posted down weeks. Bitcoin’s 5.08% price fall on 8th February highlighted that crypto bulls might not have things all their own way.
Bitcoin Price Chart – Daily Price Chart
Source: IG
Bitcoin Long positions
- Entry Level 1: 20,434 – Any further weakness which takes price towards the psychologically important 20,000 price level would also bring the 50 SMA on the Daily Price Chart into play. That metric currently sits in the region of 20,424.
- Price Target 1: 24,251 – Year-to-date price high of 2nd February and region of the psychologically important, 24,000 ‘round number’ price level.
- Price Target 2: 25,204 – Price high of 2022, recorded on 15th August.
- Stop Losses: < 20,000 – ‘Round number’ support level.
Ethereum
Ethereum Chart – Daily Price Chart
Source: IG
Ethereum Long positions
- Entry Level 1: 1,609 – Last week’s sell-off has taken the price of Ether to levels where it has tested (but failed to break) the 50 SMA on the Daily Price Chart.
- Price Target 1: 2,000 – Psychologically important ‘round number’ resistance price level. Also, the region of the price high of 13th August 2022.
- Stop Losses: < 1,462 – Closing price of Friday 13th January. Could be tested by a gap-fill price move.
Risk Statement: Trading financial products carries a high risk to your capital, especially trading leverage products such as CFDs. They may not be suitable for everyone. Please make sure that you fully understand the risks. You should consider whether you can afford to take the risk of losing your money.

Forextraders' Broker of the Month
BlackBull Markets is a reliable and well-respected trading platform that provides its customers with high-quality access to a wide range of asset groups. The broker is headquartered in New Zealand which explains why it has flown under the radar for a few years but it is a great broker that is now building a global following. The BlackBull Markets site is intuitive and easy to use, making it an ideal choice for beginners.