
FOCUS ON: US Jobs Numbers
- Risk-on assets bounce off key support levels.
- Price levels are now testing indicators which once provided support but now offer resistance.
- US Non-Farm Payrolls jobs number is due on Friday.
Trading Ideas
We created this Weekly Tips section to share possible trade entry and exit points based on our technical analysis. We also have other methods to validate our trades which we can’t publicly share, that help to increase their success. All our trades include entry and at least one target price. Stop losses are applied at the reader’s discretion. Our strategies typically trade with a wide stop loss, and risk is further mitigated by trading in small sizes.
Instrument | Price | Hourly | Daily |
GBP/USD | 1.2028 | Neutral | Neutral |
EUR/USD | 1.0648 | Strong Buy | Buy |
USD/JPY | 135.86 | Neutral | Strong Buy |
S&P 500 | 4,049 | Strong Buy | Strong Buy |
NASDAQ 100 | 12,317 | Strong Buy | Strong Buy |
FTSE100 | 7,939 | Neutral | Buy |
Gold | 1,854 | Strong Buy | Strong Buy |
Crude Oil WTI | 79.53 | Strong Buy | Strong Buy |
Bitcoin | 22,374 | Sell | Sell |
Ethereum | 1,560 | Sell | Strong Sell |
UTC: 09:48
US Dollar Basket Index (DXY)
One of the month’s most significant economic news releases is due on Friday 10th March when the US Non-Farm Payrolls jobs report will hit the markets at 1.30 pm GMT. Any sign that the US economy is overheating will renew fears of higher interest rates for longer, while a sign that monetary policy is beginning to reduce inflationary pressures could be followed by a rally in risk-on assets.
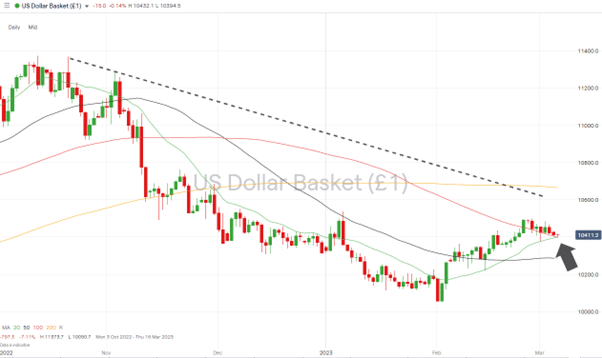
The prelude to the announcement might see investors hold off on major decisions. That could result in sideways price trends; a scenario made more likely by price in major markets sitting at points where key SMAs have converged.
US Dollar Basket Chart – Daily Price Chart – SMA Convergence
Source: IG
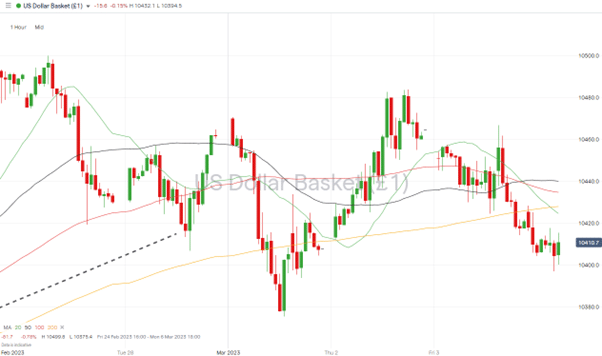
US Dollar Basket Chart – Hourly Price Chart
Source: IG
Short positions
- Entry Level 1: 103.98 – Convergence of the 20 and 100 SMAs on the Daily Price Chart makes 103.98 a key price level. A break of either would open the door to further downward price moves. RSI on the Daily Price Chart is currently at 55, which denotes the market being neither ‘overbought’ nor ‘oversold’.
- Price Target 1: 103.75 – Month-to-date price low of 1st March.
- Price Target 2: 102.87 – Region of the 50 SMA on the Hourly Price Chart. This metric provided notable price support on 14th February.
- Stop Loss: > 104.99 – Eight-week price high printed on 27th February and close to psychologically important ‘round number’ price level of 105.00.
Long positions
- Entry Level 1: 103.98 – With price currently above the 20 and 50 SMAs on the Daily Price Chart, the path of least resistance appears upward.
- Price Target 1: 104.99 – Price high printed on 27th February.
- Price Target 2: 105.37 – In extension, the year-to-date price high recorded on 6th January 2023.
- Stop Loss: < 103.75 – Round number price support/resistance level, which provided a base level for price action between 12th January and 3rd February 2023.
GBPUSD
Price action in sterling currency pairs could continue trending sideways for the first half of the week. With little UK-specific data due to be released, the ‘cable’ currency pair, GBPUSD, could be the most active market once the US jobs numbers are reported on Friday.
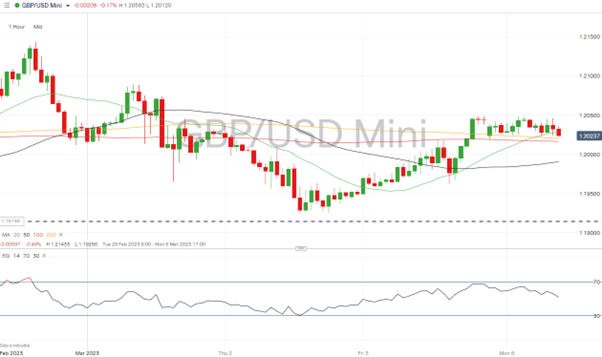
The RSI on the Daily Price Chart has traded between 40 and 48 for several weeks and continues to leave room for price to move in either direction.
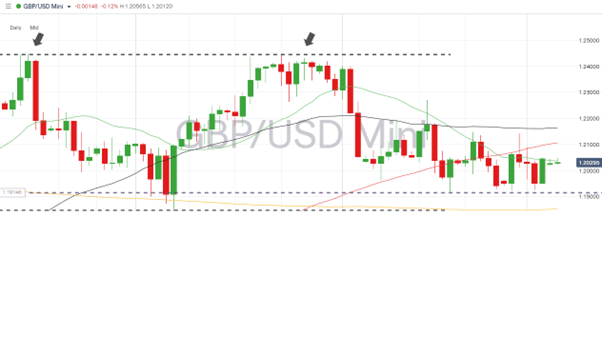
Daily Price Chart – GBPUSD Chart – Daily Price Chart
Source: IG
GBPUSD Chart – Hourly Price Chart
Source: IG
Short positions
- Entry Level 1: 1.20363 –Region of the 20 SMA on the Daily Price Chart. Application of range-trading strategies.
- Price Target 1: 1.19152 – Price low of 17th Feb. Marks bottom trendline of the sideways trading channel dating from 6th January.
- Stop Loss: > 1.21063 – Region of the 100 SMA on the Daily Price Chart and the psychologically important 1.21 round number price level.
Long positions
- Entry Level 1: 1.19152 – Price low of 17th Feb. Marks bottom trendline of the sideways trading channel dating from 6th January.
- Price Target 1: 1.20367 – Region of the 20 SMA on the Daily Price Chart.
- Price Target 2: 1.22156 – The 61.8% Fibonacci retracement price level formed by the price fall between 14th December 2022 and 6th January 2023.
- Price Target 3: 1.24480 – In extension, the year-to-date price high printed on 23rd January and upper end of the sideways price channel.
- Stop Loss: < 1.18519 – Region of 200 SMA on Daily Price Chart and multi-month price low printed on 6th January 2023.
EURUSD
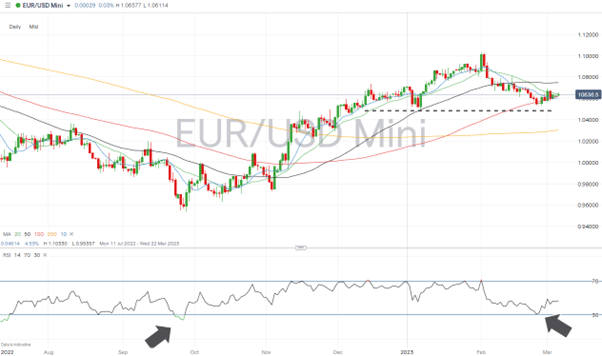
The price slide in the euro seen in February has reversed and tracked the support offered by the 100 SMA on the Daily Price Chart. While that metric and the price low of 1.05330 printed on 27th February hold, the bullish trend started in September 2022 remains intact.
The RSI has crept up from 30 to 46 in the past three weeks but is still far from being oversold on the Daily Price Chart.
EURUSD Chart – Daily Price Chart –SMA Break
Source: IG
EURUSD Chart – Hourly Price Chart
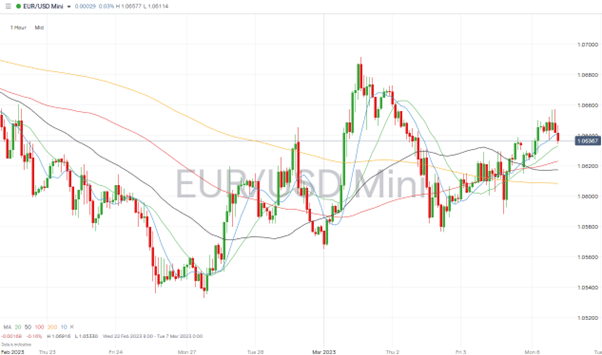
Source: IG
Short positions
- Entry Level 1: 1.06429 – Selling into strength which takes price within the range of the 20 SMA on the Daily Price Chart.
- Price Target 1: > 1.06114 – 38.2% Fib retracement level of the EURUSD price fall between January 2021 and September 2022
- Price Target 2: 1.05330 – Price low of 27th February.
- Price Target 3: 1.04822 – Price low of 6th January 2023.
- Stop Loss: > 1.06916 – Price high of 1st March 2023.
Long positions
- Entry Level 1: 1.06197 – Region of 100 SMA on Daily Price Chart.
- Price Target 1: 1.06916 – Month-to-date price high printed on 1st March.
- Price Target 2: 1.07473 – Region of the 50 SMA on the Daily Price Chart.
- Stop Loss: <1.05330 – Price low of 27th February.
Indices
S&P 500
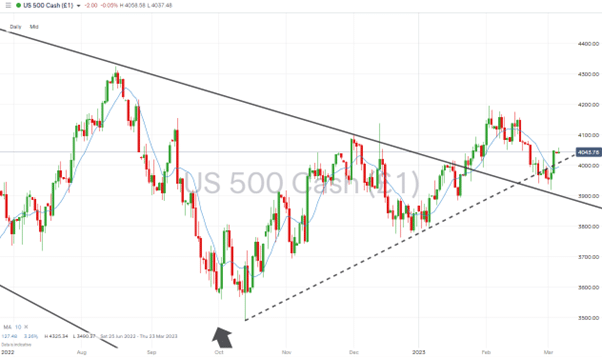
Friday’s strong rally in the S&P 500 has been followed by a drop in price volatility. The 1.86% intraday price surge has taken price back above the trendline dating from 13th October, which once again offers support to further upward price moves.
S&P 500 Chart – Daily Price Chart –SMA Support
Source: IG
S&P 500 – Hourly Price Chart
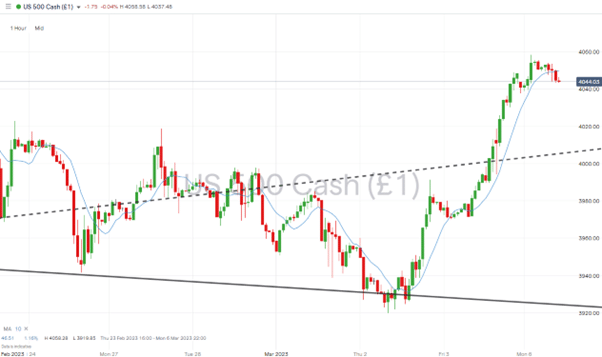
Source: IG
Short positions
- Entry Level 1: 4,000 – Applying a momentum-based strategy and selling into price weakness which takes price below the psychologically important 4k price level. Also, the region of the October-to-February trendline.
- Price Target 1: 3,947 – Region of 200 SMA on the Daily Price Chart. This metric provided significant support to price on 28th February and 1st March 2023—upper trend line of the downward price channel dating from Jan 2022.
- Stop Loss: > 4,037 – Region of convergence of 50 and 20 SMAs on the Daily Price Chart.
Long positions
- Entry Level 1: 4,031 – Using the 50 SMA as a guide for trade entry points backing Friday’s momentum will continue to steer price.
- Price Target 1: 4,195 – Year to date price high of 2nd February.
- Stop Loss: < 3,980 – Region of 100 SMA on Daily Price Chart, also, below round number 4,000 price level.
Crypto – Bitcoin & Ethereum
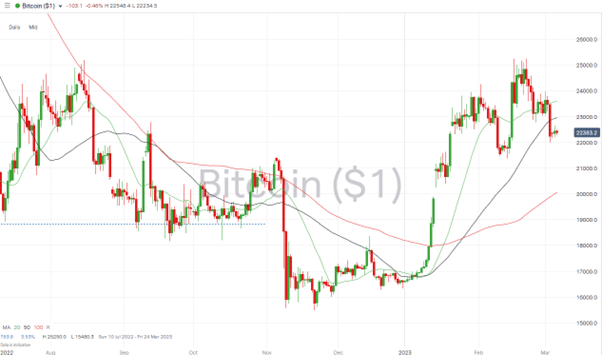
The two big crypto-assets continue to trade in line, with Bitcoin losing 4.06% in value over the last week and Ethereum giving up 4.35%. The bullish price action trends in both coins remain intact, and the recent fall ties in with other assets engaging in price consolidation.
Bitcoin Price Chart – Daily Price Chart
Source: IG
Bitcoin Long positions
- Entry Level 1: 21,374 – Buying into weakness which takes price to the ‘swing-low’ price level printed on 13th February.
- Price Target 1: 22,958 – Region of 50 SMA on Daily Price Chart.
- Price Target 2: 25,250 – Year-to-date price high of 16th February. Has since then provided resistance on three separate occasions.
- Price Target 3: 28,409 – In extension, 61.8% Fib retracement level of the upward price move in BTC recorded between February 2019 and November 2021.
- Stop Losses: < 20,000 – Round number support level.
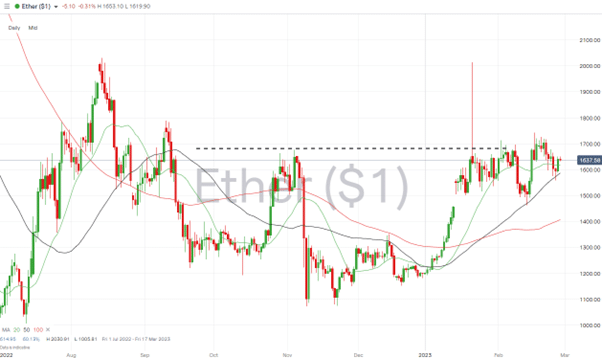
Ethereum
Ethereum Chart – Daily Price Chart
Source: IG
Ethereum Long positions
- Entry Level 1: 1,463 – Price low of 13th February. While this price level holds, Ethereum will be registering ‘higher highs and higher lows’ on price charts dating back to November 2022.
- Price Target 1: 1,742 – Price high of 16th February 2023.
- Price Target 2: 2,000 – Psychologically important round number resistance price level. Also, the region of the price high of 13th August 2022.
- Stop Losses: < 1,616 – Region of the 20 SMA on the Daily Price Chart.
Risk Statement: Trading financial products carries a high risk to your capital, especially trading leverage products such as CFDs. They may not be suitable for everyone. Please make sure that you fully understand the risks. You should consider whether you can afford to take the risk of losing your money.

Forextraders' Broker of the Month
BlackBull Markets is a reliable and well-respected trading platform that provides its customers with high-quality access to a wide range of asset groups. The broker is headquartered in New Zealand which explains why it has flown under the radar for a few years but it is a great broker that is now building a global following. The BlackBull Markets site is intuitive and easy to use, making it an ideal choice for beginners.