
During your early preparation phase as a newcomer to forex trading, you more than likely encountered the term momentum quite often – but what is momentum in the context of trading foreign currency pairs? We are not talking about a particle moving through space, but price behaviour in the forex realm does resemble a wave, and waves do possess momentum.
In our early science classes, we learned that momentum was a product of an object’s mass and its velocity and that it had both magnitude and direction. If we think about being in a moving car, we know that it has momentum and that it will take a great deal of braking energy to stop the car moving or to change its direction.

This same concept applies to forex pricing waves. The presumption is that a wave has direction and a level of energy, which will require force to slow it down or change its direction. In forex, investor sentiment drives price direction and creates the momentum of its wave. This presumption is the basis for a series of technical indicators – your best tools when trading forex.
An entire field of study has developed around this principle, called the Elliott Wave Theory. It postulates that investor psychology moves between optimism and pessimism, thereby creating wave momentum that repeats in sequences of varying intensity and duration. Elliott enthusiasts have written books describing this form of analysis. There are also critics, but the basic principle is that momentum, especially in the forex arena, creates a pattern that can be used to your advantage.
In this article, we focus on momentum and how it can be used to gain the edge necessary to be successful at forex trading. You’ll learn how forex analysts define this term, how it is measured, some background on it and Elliott Wave Theory, and its use in indicators. We will also review an example of the momentum indicator, which is an indicator bearing the term in its name.
Background/Context
What is momentum in the context of forex trading? In the financial markets, whether they are for stocks, commodities, foreign currency pairs or other tradable assets, momentum describes a property of price behaviour that causes them to move with force in a specific direction and to continue moving in that direction until prices alter their course.
If momentum is an observable property when forex prices move in repeating waves, then it would follow that traders could use this property to tilt the odds in their favour and profit off such opportunities in the marketplace. Trading strategies have evolved over time to capitalise on this single characteristic of waves and have earned the title of momentum trading.
Not to be confused with trend trading, momentum trading attempts to take advantage of short-term moves in a major trend in progress. If we return to our ‘braking a car’ metaphor, the car is moving at a constant speed until the brakes are applied and it slows down. This ‘slowing down’ is what momentum indicators try to detect, as a signal that a change in direction of prices is imminent. We refer to these conditions as being either oversold or overbought, a sure sign that it may be advantageous to buy or sell the chosen asset.
Analysts have created a family of indicators designed to reveal these very conditions. We have given these indicators the name of oscillators, as they move both up and down about a centreline or within a specified range, while measuring changes in price momentum. In this context, the indicator does not focus on the actual price, but it does measure the rate of change in forex prices – the currency pair’s velocity, if you will.
Related Articles
Many of these oscillators have household names familiar to every forex trader. Some of the more popular ones are the Reserve Strength Index (RSI), the moving average convergence/divergence (MACD), stochastics, Commodity Channel Index (CCI) and, of course, the momentum indicator (MOM). The latter actually has two versions, depending on whether you wish to follow changes as an amount difference or as a percentage.
Oscillators are said to be leading indicators because they predict an imminent change in momentum (i.e., pricing direction), but a trader must always weigh their signals in the context of the ongoing trend. It is common for momentum to recede as investors take profits, and then surge once more after profit taking has passed. Short squeezes have also propelled trends forward, driving momentum north, but traders must always be wary of false signals.
Elliott Wave Theory
The Elliott Wave Theory is often referred to as technical analysis on steroids. It was the brainchild of Ralph Nelson Elliott, who studied financial market trends and cycles and published his primary works in the 1930s. His work provided the basic framework for several analytical tools that quantify momentum changes and suggest how market prices might move in patterns.
At the basic core of his technical research, Elliott attempted to correlate the physics around us with the natural flow of supply and demand forces. He identified a series of wave patterns, driven by changes in momentum, primarily two in number – an ‘impulse’ wave that is full of energy (momentum) and consistently forms five legs as it vibrates along, and its polar opposite, a ‘corrective’ wave, which typically moves more slowly or in a sideways manner.
He combined these wave principles with Fibonacci ratios and channelling techniques to reveal that the ebbs and flows of momentum tend to change direction about levels of support and resistance or within the boundaries of two parallel lines, before a breakout or reversal occurs.
Like other technical tools, these principles are not perfect, but they can provide enough consistency to give a trader an edge in the market.
Momentum Indicators in Forex
Studies like these from Elliott provided the basis for creating a number of momentum-based indicators to assist in trading all financial markets. We have mentioned a few above – the RSI, the MACD, the CCI, and stochastics. The momentum indicator, however, actually relates to our main subject matter.
The MOM comes in two flavours, either reflecting a change in amount or a percentage change. In each case, the calculation method is similar. A current closing price is compared to a close from ‘X’ periods back. The results are plotted over time, and fluctuations point to major changes in momentum, signalling a shift in the mood of investors.
As with all indicators, experience in using the MOM on a demo system will help you become familiar with its nuances. The indicator is displayed on the bottom of the chart and appears as a fluctuating line that can resemble the form of a wave. There are also key points of reference: high and low values signify overbought and oversold conditions.
An astute trader can also pick up clues on how the line behaves around the midpoint or middle area of the indicator box, as well as when divergences appear when comparing the flow of prices and the direction of the oscillator. However, the MOM can send false signals. No indicator is correct all the time, but the signals from the momentum indicator can be consistent enough to tilt the odds in your favour.
Example
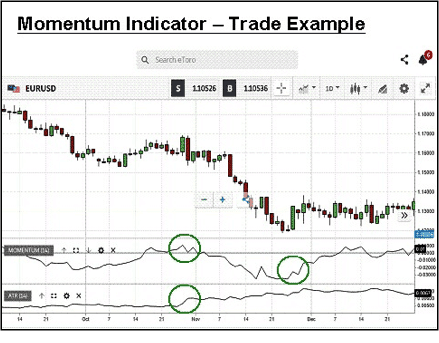
How do you use and interpret the momentum indicator in real time? Before answering this question, let’s take a look at a real-time chart from eToro:
Here we have a daily chart for the popular EUR/USD currency pair. The momentum indicator is paired with the average true range (ATR) indicator on the bottom of the chart. The scale for the MOM, shown on the right-hand side, is for amount differences, both negative and positive, about a ‘zero’ centreline.
The green circles added to the chart encircle key signals from the indicator when the momentum has definitely shifted. It is always best to use an additional indicator to confirm your primary signals, as an assurance of the validity of the alert and to bring more consistency to the interpretation process. In this case, the ATR reveals an abrupt increase in activity, a sign of an imminent change. Taken together, a forex trader could have leveraged these insights for a healthy gain.
Conclusion
Momentum is a very important term in the world of forex trading. Prices undoubtedly move in waves, and waves have energy behind them, the essence of why momentum studies are as significant as they are. These studies have ranged from the complex, as in the Elliott Wave Theory, to more direct research in measurement methods and the development of indicators.
There are several popular momentum indicators in use today. The RSI, the MACD and the MOM are just three industry favourites. Each one attempts to measure the rate of change in prices over time. A material change reflects a shift in investor sentiment, the force that drives price behaviour. On a demo system, try developing a momentum trading strategy, testing it out, and then incorporating it into your daily trading regimen.

Forextraders' Broker of the Month
BlackBull Markets is a reliable and well-respected trading platform that provides its customers with high-quality access to a wide range of asset groups. The broker is headquartered in New Zealand which explains why it has flown under the radar for a few years but it is a great broker that is now building a global following. The BlackBull Markets site is intuitive and easy to use, making it an ideal choice for beginners.