
The Elliott Wave Principle, or Elliott Wave Theory, is a type of technical analysis that was founded by Ralph Nelson Elliott in the 1930s. It is based on the idea that market prices unfold in specific patterns.

These patterns, most commonly known as Elliott waves, can be very useful to analyse market cycles and to forecast market trends by identifying extremes in investor psychology and price levels.
In this article, we will explore the basics of the Elliott Wave Principle and how it can be used to analyse the markets.
Basic Elliott Wave Structure
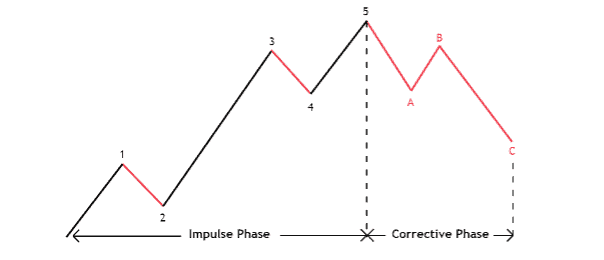
Ralph Nelson Elliott studied a considerable amount of historical price data that covered many markets and different timeframes. What he discovered was that trends trace out 5 waves, before they terminate, followed by a corrective phase that traces out 3 waves.
The diagram above illustrates the basic wave structure of both the trending phase (commonly known as the impulse phase) and the corrective phase.
Even during the impulsive phase of a trending market, small corrections will occur during wave 2 and wave 4, but they are smaller in nature than the corrective phase that follows after a 5-wave sequence.
Now that we have covered what the basic structure of a trend and corrective phase looks like, we need to discuss some basic rules/guidelines that the Elliott Wave Principle suggests.
These guidelines will help to determine whether a market is trending or correcting and will help forecast where each individual wave might find support or resistance.
Knowing these guidelines can help you decide where a market is within each particular phase.
Elliott Wave principle Guidelines
During the impulse phase, wave 2 is corrective, but according to the rules of the Elliott Wave Principle, wave 2 should not move below the start of wave 1 (in a bullish scenario).
Wave 3 will move beyond the end of wave 1 and is generally longer than waves 1 and 5.
Wave 4 is also corrective but should never reach the price level where wave 1 ended.
Wave 5 should extend above the end of wave 3, or at the very least, reach the high (in a bullish scenario) of wave 3.
Following the ‘waves’ with these guidelines in mind will either tell you if a market is trending or whether something else is going on. For example, let’s say you believe that a wave 3 has ended and that a corrective wave 4 is underway. Then, according to the Elliott Wave Principle guidelines, you know that wave 4 should not reach the high/low of wave 1.
If price reaches the price level where you labelled wave 1 on your chart, then it invalidates the idea that the market is in an impulse phase. When this happens, you might need to consider that a larger corrective phase is underway instead.
Although these guidelines are pretty easy to understand, it can be difficult at times to implement them when you look at a live chart of your favourite market. Where do you start counting your waves from, for example?
Luckily for us, the Elliott Wave Principle has a very close relationship with Fibonacci ratios, meaning that each wave tends to end at specific Fibonacci ratios, whether they are corrective or impulsive.
Knowing which Fibonacci ratios Elliott waves tend to reach and react from can help a great deal in knowing which wave a market might be in, or where a specific wave might move towards. Using Fibonacci ratios simplifies the process of counting and labelling waves correctly.
Elliott Wave principle and Fibonacci Ratios
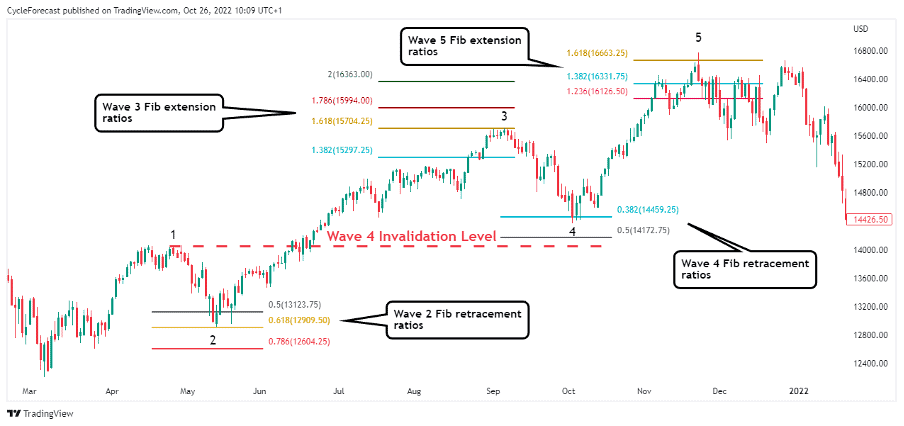
Image for illustration purposes only
The chart image above is a near-perfect example of how each individual wave during an impulse wave finds support or resistance before the next wave starts.
Wave 2
Wave 2s, as we know by now, are corrective, and assuming that a wave 1 has completed, the Fibonacci retracement tool can be used to find the price levels where wave 2s typically end.
Simply start drawing your Fibonacci retracement levels by selecting the starting point and the end point of wave 1. Wave 2s generally find support at the 50%, 61.8% and 78.6% Fibonacci retracement ratios.
Traders who use Elliott Wave Principle to analyse the markets will keep a close eye on these ratios and wait for signs of a reversal. Entering a position as soon as a trader assumes that a 2nd wave has ended and that a 3rd wave has started is a common objective among Elliott Wave theorists.
Wave 3
Knowing that the 3rd wave of an impulse phase is generally the longest, traders will want to ‘ride’ the 3rd wave because it offers the most profit potential.
The 3rd wave generally reaches the 138.2% Fibonacci extension level at a minimum, but often extends towards the 161.8%, 178.6% or 200% ratios, or even higher.
To find these extension levels, simply use the Fibonacci extension tool. Start the drawing by selecting the beginning of wave 1, then the end of wave 1, and finally the end of wave 2. The Fibonacci extension tool will then automatically project the extension ratios in the direction of the presumed trend.
On the chart image above, wave 3 reached the 161.8% Fibonacci extension level before wave 4 started. Again, knowing where Elliott waves tend to terminate would have been helpful if you traded a 3rd wave, allowing you to set your targets at these extension levels.
Wave 4
The 4th wave of an impulse phase is also corrective, and just like wave 2, tends to find support/resistance at specific Fibonacci retracement levels.
Common retracement levels where wave 4s end are the 38.2% and 50% Fibonacci ratios. Assuming that you are dealing with a 4th wave correction, simply use your Fibonacci retracement tool again and start the drawing by selecting the starting point and the end point of wave 3.
Note: There might be instances where a 4th wave corrects towards the 61.8% Fibonacci retracement level, but remember the guidelines we mentioned previously. Wave 4s should not reach the level where wave 1 ended, so if a 61.8% Fibonacci retracement level lies above the end point of wave 1, then this ratio can also act as support.
Wave 5
The final 5th wave of an impulsive phase generally extends beyond the end of wave 3, and in many instances can be as long as wave 1 in height or reach the 123.6%, 138.2% or 161.8% Fibonacci extension ratios of wave 4.
To draw the Fibonacci extension levels on your chart to find where a wave 5 might end, simply start by selecting the end of wave 4, then select the end of wave 3, and lastly select the end of wave 4 again.
This procedure measures the length of wave 4 and projects it higher again to find the potential end point of wave 5.
Alternatively, you could use the Fibonacci retracement tool and start your drawing from the end of wave 3 to the end of wave 4, but rather than looking at the retracement levels, you are looking for the inverse retracement levels of wave 4.
Elliott Wave Corrections
Now that we have discussed the basic wave structure of the Elliot Wave Theory and how Fibonacci ratios play an integral part with this type of analysis, we will next take a look at the various types of corrective patterns that Ralph Nelson Elliott included in his theory.
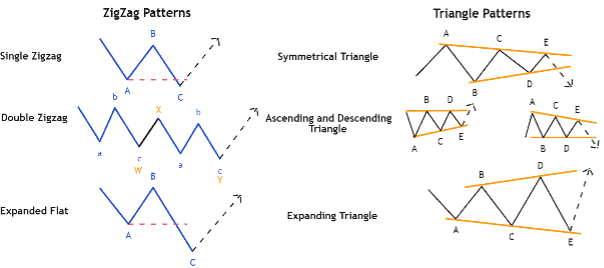
Corrective phases trace out patterns that fall under two distinct categories: zigzag patterns and triangle patterns.
Zigzag Patterns
Zigzag patterns can be further divided into three different variations: single zigzags, double zigzags, and expanded flats.
- Single zigzags are the most common corrective patterns and consist of three waves – labelled A, B and C. With single zigzags, the C wave generally travels the same distance as the A wave and extends slightly below the end of the A wave (during a pullback within a bullish trend).
- Double zigzags are essentially two single zigzags that appear after each other, but they are joined together by an additional wave called the W-X wave. The entire corrective pattern is labelled W-X-Y.
- Expanded flats are like single zigzags, with the only two differences being that the B wave normally ends in line with the start of the correction, and the C wave extends further below the end of the A wave than a single zigzag would.
Triangle Patterns
Triangle patterns can also be divided into three variations: symmetrical triangles, ascending or descending triangles, and expanding triangles.
All triangle pattern variants consist of 5 sub-waves labelled A-B-C-D-E, with the only difference between the variants being the shape of the entire triangle itself.
Note: Ascending and descending triangles fall under the same variant, with the only difference being that ascending triangles have a horizontal top and descending triangles have a horizontal bottom. Although their shapes are different, an ascending triangle tends to forecast a potential bullish breakout, whereas a descending triangle forecasts a potential bearish breakout.
Related Articles
Conclusion
Elliott Wave Principle is a powerful tool for analysing financial markets, but it is not without its critics. Some argue that the theory is too complex and difficult to use in practice, while others maintain that it is an essential tool for understanding market behaviour and investor sentiment.
Whatever your opinion, there is no denying that Elliott Wave Principle is a fascinating way of looking at market movements, and one that can provide valuable insights into where prices are headed next.

Forextraders' Broker of the Month
BlackBull Markets is a reliable and well-respected trading platform that provides its customers with high-quality access to a wide range of asset groups. The broker is headquartered in New Zealand which explains why it has flown under the radar for a few years but it is a great broker that is now building a global following. The BlackBull Markets site is intuitive and easy to use, making it an ideal choice for beginners.